- Power BI forums
- Updates
- News & Announcements
- Get Help with Power BI
- Desktop
- Service
- Report Server
- Power Query
- Mobile Apps
- Developer
- DAX Commands and Tips
- Custom Visuals Development Discussion
- Health and Life Sciences
- Power BI Spanish forums
- Translated Spanish Desktop
- Power Platform Integration - Better Together!
- Power Platform Integrations (Read-only)
- Power Platform and Dynamics 365 Integrations (Read-only)
- Training and Consulting
- Instructor Led Training
- Dashboard in a Day for Women, by Women
- Galleries
- Community Connections & How-To Videos
- COVID-19 Data Stories Gallery
- Themes Gallery
- Data Stories Gallery
- R Script Showcase
- Webinars and Video Gallery
- Quick Measures Gallery
- 2021 MSBizAppsSummit Gallery
- 2020 MSBizAppsSummit Gallery
- 2019 MSBizAppsSummit Gallery
- Events
- Ideas
- Custom Visuals Ideas
- Issues
- Issues
- Events
- Upcoming Events
- Community Blog
- Power BI Community Blog
- Custom Visuals Community Blog
- Community Support
- Community Accounts & Registration
- Using the Community
- Community Feedback
Register now to learn Fabric in free live sessions led by the best Microsoft experts. From Apr 16 to May 9, in English and Spanish.
- Power BI forums
- Forums
- Get Help with Power BI
- Desktop
- Trying to create a column per year
- Subscribe to RSS Feed
- Mark Topic as New
- Mark Topic as Read
- Float this Topic for Current User
- Bookmark
- Subscribe
- Printer Friendly Page
- Mark as New
- Bookmark
- Subscribe
- Mute
- Subscribe to RSS Feed
- Permalink
- Report Inappropriate Content
Trying to create a column per year
Hi Guys!
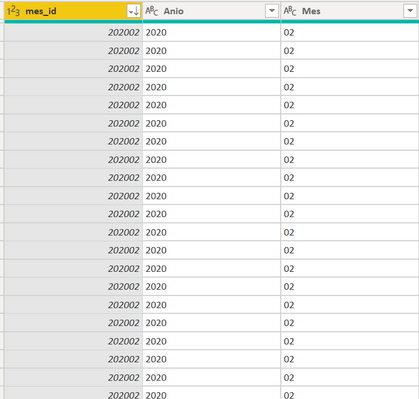
I do haven issue, I've been told to make a column based on another column call month_id.
Basically it's the combine of year and month.
And I need to make a table like this one below. Adding a column per mes_id.
| Segment | 202001 | 202002 |
| S1 | .00001 | .2300 |
| S2 | .002341 | .009134 |
I tried by pivot but not sure yet how it works.
Does anybody have an idea how can I reach this result?
Thanks for the help!
Solved! Go to Solution.
- Mark as New
- Bookmark
- Subscribe
- Mute
- Subscribe to RSS Feed
- Permalink
- Report Inappropriate Content
You can by using the Pivot Column feature in the Transpose tab of Power Query but I recommend against it. It will make your life miserable when trying to create visuals and measures in DAX. Plus, if you have thousands or millions of rows, it won't pivot. It will just throw an error.
Pull your data in as is. Then add a Matrix visual, and add the mes_id column to the Columns setting, Segments to the rows, and your data to the values. It will just work.
If that doesn't help, please share a PBIX file with some sample data so we can see the entire picture. Your sample image for example doesn't have the data you want in your expected result, so it is kinda hard to ensure a proposed solution will work.
Did I answer your question? Mark my post as a solution!
Did my answers help arrive at a solution? Give it a kudos by clicking the Thumbs Up!
DAX is for Analysis. Power Query is for Data Modeling
Proud to be a Super User!
MCSA: BI Reporting- Mark as New
- Bookmark
- Subscribe
- Mute
- Subscribe to RSS Feed
- Permalink
- Report Inappropriate Content
I tryied the matrix thing an it works perfectly.
I was sure that the solution was easy but didn't know how to do it.
Thank you for the help!
Grettings
- Mark as New
- Bookmark
- Subscribe
- Mute
- Subscribe to RSS Feed
- Permalink
- Report Inappropriate Content
Did I answer your question? Mark my post as a solution!
Did my answers help arrive at a solution? Give it a kudos by clicking the Thumbs Up!
DAX is for Analysis. Power Query is for Data Modeling
Proud to be a Super User!
MCSA: BI ReportingHelpful resources

Microsoft Fabric Learn Together
Covering the world! 9:00-10:30 AM Sydney, 4:00-5:30 PM CET (Paris/Berlin), 7:00-8:30 PM Mexico City

Power BI Monthly Update - April 2024
Check out the April 2024 Power BI update to learn about new features.

| User | Count |
|---|---|
| 114 | |
| 100 | |
| 75 | |
| 73 | |
| 49 |
| User | Count |
|---|---|
| 145 | |
| 109 | |
| 109 | |
| 90 | |
| 64 |

