- Power BI forums
- Updates
- News & Announcements
- Get Help with Power BI
- Desktop
- Service
- Report Server
- Power Query
- Mobile Apps
- Developer
- DAX Commands and Tips
- Custom Visuals Development Discussion
- Health and Life Sciences
- Power BI Spanish forums
- Translated Spanish Desktop
- Power Platform Integration - Better Together!
- Power Platform Integrations (Read-only)
- Power Platform and Dynamics 365 Integrations (Read-only)
- Training and Consulting
- Instructor Led Training
- Dashboard in a Day for Women, by Women
- Galleries
- Community Connections & How-To Videos
- COVID-19 Data Stories Gallery
- Themes Gallery
- Data Stories Gallery
- R Script Showcase
- Webinars and Video Gallery
- Quick Measures Gallery
- 2021 MSBizAppsSummit Gallery
- 2020 MSBizAppsSummit Gallery
- 2019 MSBizAppsSummit Gallery
- Events
- Ideas
- Custom Visuals Ideas
- Issues
- Issues
- Events
- Upcoming Events
- Community Blog
- Power BI Community Blog
- Custom Visuals Community Blog
- Community Support
- Community Accounts & Registration
- Using the Community
- Community Feedback
Register now to learn Fabric in free live sessions led by the best Microsoft experts. From Apr 16 to May 9, in English and Spanish.
- Power BI forums
- Forums
- Get Help with Power BI
- Desktop
- Try to show the missing rows from a table in my re...
- Subscribe to RSS Feed
- Mark Topic as New
- Mark Topic as Read
- Float this Topic for Current User
- Bookmark
- Subscribe
- Printer Friendly Page
- Mark as New
- Bookmark
- Subscribe
- Mute
- Subscribe to RSS Feed
- Permalink
- Report Inappropriate Content
Try to show the missing rows from a table in my report.
Hello everyone,
I receive sales files every month from different sources ; I merge them in PBI to show KPIs to my team.
Some months, I don't receive a file from one or some source, so the "YearToDate" KPIs do not represent the reality because a file is missing for a month.
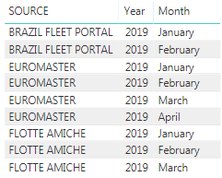
For the moment, I show, in a table next to my KPIs visualizations, all the "avaibalble" months for each source.
The problem is that the list can be long if we multiply the sources and the months.
Below an example of 3 sources for YTD from January to April 2019.
We can see that I miss March & April for BRAZIL FLEET PORTAL and only April for FLOTTE AMICHE.
- The perfect solution would be for the table shows only the missing months. But I just don't know how to do this.
- An other solution would be showing for each source and for each year, the number of month available.
I tried by creating a measure with this function : NbMonths = DISTINCTCOUNT(DATES[DATE].[Month])
But I finally have this result :
The "4" probably corresponds to the number of months I choose in my filter to do my YTD Visualization.
If you have an idea about it, please tell me ! 🙂
Thanks!
Solved! Go to Solution.
- Mark as New
- Bookmark
- Subscribe
- Mute
- Subscribe to RSS Feed
- Permalink
- Report Inappropriate Content
does this work properly? you need to adjust the Table name
NoOfMonths =
COUNTROWS(SUMMARIZE(Table, Table[SOURCE], DATES[MONTH]))
Thank you for the kudos 🙂
- Mark as New
- Bookmark
- Subscribe
- Mute
- Subscribe to RSS Feed
- Permalink
- Report Inappropriate Content
does this work properly? you need to adjust the Table name
NoOfMonths =
COUNTROWS(SUMMARIZE(Table, Table[SOURCE], DATES[MONTH]))
Thank you for the kudos 🙂
- Mark as New
- Bookmark
- Subscribe
- Mute
- Subscribe to RSS Feed
- Permalink
- Report Inappropriate Content
Hello Statchu, Thanks it's working !
I can be staisfied with this solution.
But the perfect solution would be to just show the missing months ; if you understand.
Do you think it's possible ?
Thank for your help !
- Mark as New
- Bookmark
- Subscribe
- Mute
- Subscribe to RSS Feed
- Permalink
- Report Inappropriate Content
try something like this
Measure =
VAR __MonthsInScope = SUMMARIZE('Table',DATES[Month])
VAR __AllMonths = ALLSELECTED(DATES[Month])
VAR __MonthsNotInScope = EXCEPT(__AllMonths, __MonthsInScope)
RETURN
CONCATENATEX(__MonthsNotInScope, [Month], ";")
Thank you for the kudos 🙂
- Mark as New
- Bookmark
- Subscribe
- Mute
- Subscribe to RSS Feed
- Permalink
- Report Inappropriate Content
It doesn't work, but I get the idea so I will work on it. 😉
I will post the "algorithme" if I can get it to work.
Thank you a lot Stachu ! 🙂
Helpful resources

Microsoft Fabric Learn Together
Covering the world! 9:00-10:30 AM Sydney, 4:00-5:30 PM CET (Paris/Berlin), 7:00-8:30 PM Mexico City

Power BI Monthly Update - April 2024
Check out the April 2024 Power BI update to learn about new features.

| User | Count |
|---|---|
| 109 | |
| 98 | |
| 77 | |
| 66 | |
| 54 |
| User | Count |
|---|---|
| 144 | |
| 104 | |
| 100 | |
| 86 | |
| 64 |


