- Power BI forums
- Updates
- News & Announcements
- Get Help with Power BI
- Desktop
- Service
- Report Server
- Power Query
- Mobile Apps
- Developer
- DAX Commands and Tips
- Custom Visuals Development Discussion
- Health and Life Sciences
- Power BI Spanish forums
- Translated Spanish Desktop
- Power Platform Integration - Better Together!
- Power Platform Integrations (Read-only)
- Power Platform and Dynamics 365 Integrations (Read-only)
- Training and Consulting
- Instructor Led Training
- Dashboard in a Day for Women, by Women
- Galleries
- Community Connections & How-To Videos
- COVID-19 Data Stories Gallery
- Themes Gallery
- Data Stories Gallery
- R Script Showcase
- Webinars and Video Gallery
- Quick Measures Gallery
- 2021 MSBizAppsSummit Gallery
- 2020 MSBizAppsSummit Gallery
- 2019 MSBizAppsSummit Gallery
- Events
- Ideas
- Custom Visuals Ideas
- Issues
- Issues
- Events
- Upcoming Events
- Community Blog
- Power BI Community Blog
- Custom Visuals Community Blog
- Community Support
- Community Accounts & Registration
- Using the Community
- Community Feedback
Register now to learn Fabric in free live sessions led by the best Microsoft experts. From Apr 16 to May 9, in English and Spanish.
- Power BI forums
- Forums
- Get Help with Power BI
- Desktop
- Total is wrong
- Subscribe to RSS Feed
- Mark Topic as New
- Mark Topic as Read
- Float this Topic for Current User
- Bookmark
- Subscribe
- Printer Friendly Page
- Mark as New
- Bookmark
- Subscribe
- Mute
- Subscribe to RSS Feed
- Permalink
- Report Inappropriate Content
Total is wrong
Hello,
I have calculated measure Total_LC as given below
Total_LC =
VAR F12 = SUM('NCC Chart''s'[F12])
VAR H12 = SUM('NCC Chart''s'[H12])
RETURN
(average('NCC Chart''s'[Net_NCC_Cost])+
(IF( (H12 - F12) > 0, -(H12 - F12)*1000000, (-H12 + F12)*1000000)))
But when I tried to create a table, the total for Total_LC is showing wrong as shown below;
Can you please tell me what am I doing wrong here?
thanks
Bhavesh
Solved! Go to Solution.
- Mark as New
- Bookmark
- Subscribe
- Mute
- Subscribe to RSS Feed
- Permalink
- Report Inappropriate Content
Hi,
You may download my PBI file from here.
Hope this helps.
Regards,
Ashish Mathur
http://www.ashishmathur.com
https://www.linkedin.com/in/excelenthusiasts/
- Mark as New
- Bookmark
- Subscribe
- Mute
- Subscribe to RSS Feed
- Permalink
- Report Inappropriate Content
Hi @Bhaveshp,
Could you please tell me if your problem has been solved? If it is, could you please mark the helpful replies as Answered?
Regards,
Daniel He
If this post helps, then please consider Accept it as the solution to help the other members find it more quickly.
- Mark as New
- Bookmark
- Subscribe
- Mute
- Subscribe to RSS Feed
- Permalink
- Report Inappropriate Content
Hi @Bhaveshp,
This is a common issue, you could refer to these links which explain why and how to resolve it:
https://community.powerbi.com/t5/DAX-Commands-and-Tips/Dealing-with-Measure-Totals/td-p/63376
https://powerpivotpro.com/2012/03/subtotals-and-grand-totals-that-add-up-correctly/
Regards,
Daniel He
If this post helps, then please consider Accept it as the solution to help the other members find it more quickly.
- Mark as New
- Bookmark
- Subscribe
- Mute
- Subscribe to RSS Feed
- Permalink
- Report Inappropriate Content
Hi,
Create the following measures
F12 total = SUM('NCC Chart''s'[F12])
H12 total = SUM('NCC Chart''s'[H12])
Total_FC=SUMX(SUMMARIZE(VALUES('NCC Chart''s'[Project_Number]),[Project_Number],"ABCD",average('NCC Chart''s'[Net_NCC_Cost])+IF(H12-F12>0,-(H12-F12)*1000000,(-H12+F12)*1000000)),[ABCD])
In your visual drag replace H12, F12 and Total_FC with the measures created above.
Hope thsi helps.
Regards,
Ashish Mathur
http://www.ashishmathur.com
https://www.linkedin.com/in/excelenthusiasts/
- Mark as New
- Bookmark
- Subscribe
- Mute
- Subscribe to RSS Feed
- Permalink
- Report Inappropriate Content
Dear all, sorry to enter your discussion but it is really a KEY point for my project and I am trying to solve it since many days with no success.
My situation is exactely the same, looking at the results, but different about the origin of the data.
Please try to help me!!!!! (Let me know if I should write a new post....)
I think I understood the solutions offered using SUMX, but it seems referred to data that are in a table.
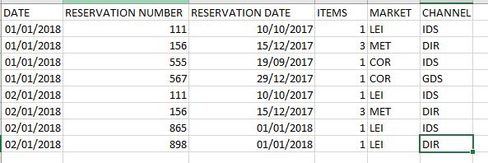
I.E. if I have I table like the following one:
DATE value1 value2
01 jan 18 10 15
02 jan 18 5 1
03 jan 18 7 2
In this case, if I should choose between "value1" and "value2" under certain conditions, it seems possible to use SUMX with an IF statement ore HASONEVALUE and so on. (Reading aroung on theweb it seems to be the most used solution)
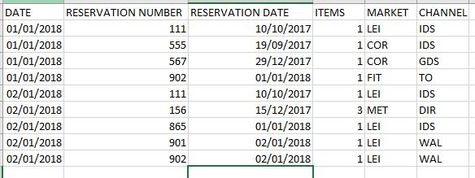
But MY situation is that I have 2 tables (from a database) from which to take the information, and managed through measures.
Like followings:
FORECAST:
DEFINITE:
So the values I have to show are not originated from values from one table, but they are measures originated from 2 tables . (Actually it is a simplification... in reality they are measures coming from other measures filtered by other elements...but all of them from 2 original tables)
They are:
OTB FORECAST = SUM(FORECAST[ITEMS])
OTB DEFINITE = SUM(DEFINTE[ITEMS])
My needed results are also depending to a "reading date":
for a certain date ( i.e. 2nd jan) if the reading date is later than the date we are looking at, then show "DEFINITE", otherwise show "FORECAST":
ACTUAL = IF([maxreadingdate]<=[maxdate];[OTB FORECAST];[OTB DEFINITE])
You can see from the image below it is ok, except than for the month total that, for ACTUAL, should be 673. The presence of the "maxdate" and "mareadingdate" on the "month total" row demonstrate the way PowerBI manage this situation:
on the "month total" row the IF statement is satisfied, therefore it makes the calculation on the "OTB FORECAST" values.
About SUMX: I have seen that SUMX applies to TABLES. But as said my [OTB FORECAST] and [OTB DEFINITE] are not in a table... they are measures...
It seems I cannot use it!
Also the "HASONEVALUE" cannot be applied...
AAARRRGHHH !!!!! I REALLY REALLY NEED HELP!!! Feeling really frustrated.
Thank you guys!
Alessandro.
- Mark as New
- Bookmark
- Subscribe
- Mute
- Subscribe to RSS Feed
- Permalink
- Report Inappropriate Content
Hi all it's me again, if you like to help here you can find the pbix file and datas....
https://1drv.ms/f/s!Ar-kpjLj8CF4jFsje0NU4qE0VmwH
Thank you again.
Alessandro
- Mark as New
- Bookmark
- Subscribe
- Mute
- Subscribe to RSS Feed
- Permalink
- Report Inappropriate Content
Hi,
You may download my PBI file from here.
Hope this helps.
Regards,
Ashish Mathur
http://www.ashishmathur.com
https://www.linkedin.com/in/excelenthusiasts/
- Mark as New
- Bookmark
- Subscribe
- Mute
- Subscribe to RSS Feed
- Permalink
- Report Inappropriate Content
GREAT !!!! Thank you so much Ashish_Mathur, it works!!!!!
Really the biggest thank you!
I would never had reached the solution by myself. I will study it deeply.
Now... I realized I cannot markl this post as "solved" since the original post is not mine... am I correct?
Is there anyway for me to confirm in this community that you solved my problem ?
Alessandro.
- Mark as New
- Bookmark
- Subscribe
- Mute
- Subscribe to RSS Feed
- Permalink
- Report Inappropriate Content
You are welcome. Please kudos my post which has the formula.
Regards,
Ashish Mathur
http://www.ashishmathur.com
https://www.linkedin.com/in/excelenthusiasts/
- Mark as New
- Bookmark
- Subscribe
- Mute
- Subscribe to RSS Feed
- Permalink
- Report Inappropriate Content
Done, with the greatest pleasure!
Thank you again!
- Mark as New
- Bookmark
- Subscribe
- Mute
- Subscribe to RSS Feed
- Permalink
- Report Inappropriate Content
Hi @Bhaveshp,
When you make a measure and add it to a table the measure is calculated in all row including the total, so you need to add a summarization formula in order to have the correct calculation on your total.
Add the following measure and put it on your table:
Total_LC_Row =
IF (
    HASONEVALUE ( Table[Project_Number] );
    [Total_LC];
    SUMX ( Table; [Total_LC] )
)
What this formula does is to check if you have a single value in project number if yes it then does the Total_LC calculation if you don't have a single value in project_number as it happen in total then it does the SUM row by row of each project and returns that total.
You can read more about the SUMX in the following link
Regards,
MFelix
Regards
Miguel Félix
Did I answer your question? Mark my post as a solution!
Proud to be a Super User!
Check out my blog: Power BI em Português- Mark as New
- Bookmark
- Subscribe
- Mute
- Subscribe to RSS Feed
- Permalink
- Report Inappropriate Content
Hello, I tried using your formula but my grand total is still the same
- Mark as New
- Bookmark
- Subscribe
- Mute
- Subscribe to RSS Feed
- Permalink
- Report Inappropriate Content
Power-BI do not just sum the values in the column.
It actually executes the formula for the row in total.
So, based on your formula and the screen-shot you provided.
average('NCC Chart''s'[Net_NCC_Cost]) = -1,105,559.14
H12 - F12 ( 0.2020 - 1.3160) is not greater than 0
So your calcualtion is -H12 + F12 (-0.2020 + 1.3160) * 1000000 = 1,114,000
-1,105,559.14 + 1,114,000 = 8440.86
Helpful resources

Microsoft Fabric Learn Together
Covering the world! 9:00-10:30 AM Sydney, 4:00-5:30 PM CET (Paris/Berlin), 7:00-8:30 PM Mexico City

Power BI Monthly Update - April 2024
Check out the April 2024 Power BI update to learn about new features.

| User | Count |
|---|---|
| 113 | |
| 99 | |
| 80 | |
| 70 | |
| 59 |
| User | Count |
|---|---|
| 149 | |
| 114 | |
| 107 | |
| 89 | |
| 67 |


