- Power BI forums
- Updates
- News & Announcements
- Get Help with Power BI
- Desktop
- Service
- Report Server
- Power Query
- Mobile Apps
- Developer
- DAX Commands and Tips
- Custom Visuals Development Discussion
- Health and Life Sciences
- Power BI Spanish forums
- Translated Spanish Desktop
- Power Platform Integration - Better Together!
- Power Platform Integrations (Read-only)
- Power Platform and Dynamics 365 Integrations (Read-only)
- Training and Consulting
- Instructor Led Training
- Dashboard in a Day for Women, by Women
- Galleries
- Community Connections & How-To Videos
- COVID-19 Data Stories Gallery
- Themes Gallery
- Data Stories Gallery
- R Script Showcase
- Webinars and Video Gallery
- Quick Measures Gallery
- 2021 MSBizAppsSummit Gallery
- 2020 MSBizAppsSummit Gallery
- 2019 MSBizAppsSummit Gallery
- Events
- Ideas
- Custom Visuals Ideas
- Issues
- Issues
- Events
- Upcoming Events
- Community Blog
- Power BI Community Blog
- Custom Visuals Community Blog
- Community Support
- Community Accounts & Registration
- Using the Community
- Community Feedback
Register now to learn Fabric in free live sessions led by the best Microsoft experts. From Apr 16 to May 9, in English and Spanish.
- Power BI forums
- Forums
- Get Help with Power BI
- Desktop
- Re: Top 10,20,30 Values using Dynamic Slicer
- Subscribe to RSS Feed
- Mark Topic as New
- Mark Topic as Read
- Float this Topic for Current User
- Bookmark
- Subscribe
- Printer Friendly Page
- Mark as New
- Bookmark
- Subscribe
- Mute
- Subscribe to RSS Feed
- Permalink
- Report Inappropriate Content
Top 10,20,30 Values using Dynamic Slicer
Hi There ,
I am creating a report where i have data in table which includes column like (Unit Sold, Revenue, Order Date ,Product Id ,Product Name ) and i am trying to create dynamic table where i have a slicer of Top 10 ,20,30,50,500 but i want to filter my data when i clicked on Top 10 so it will give me top 10 productsID, Product Name and Revenue and similarly if i click on Top 20 it will shows me data for Top 20 productid, product name and revenue .
Please see below sample data for more understanding :
Table 1
| Order Date | Product Id | Product Name | Revenue | Untis Sold |
| 05/16/2021 | 110490 | Sunslik | 5.6 | 15 |
| 05/17/2021 | 1307555 | Jelly Water | 70.5 | 111 |
| 05/18/2021 | 1420880 | Hair Removal | 100.5 | 145 |
| 05/19/2021 | 1421935 | Lubricant | 15 | 12 |
| 05/20/2021 | 1373935 | Airborne | 145.45 | 45 |
Please see the attached file for more calrifaction and if anyone can help me out in this ?
Thank you in advance ,
Ashish
Solved! Go to Solution.
- Mark as New
- Bookmark
- Subscribe
- Mute
- Subscribe to RSS Feed
- Permalink
- Report Inappropriate Content
Hi @Ashish_kumar12 ,
Here are the steps you can follow:
1. Create a table.
2. Create measure.
Measure_rank =
RANKX(ALLSELECTED('Table'),CALCULATE(SUM('Table'[Revenue])),,DESC)
Measure_flag =
var _top=SELECTEDVALUE(Slice[Top])
return
IF([Measure_rank]<=_top,1,0)3. Set Sort by-[ Measure_rank] and Sort ascending.
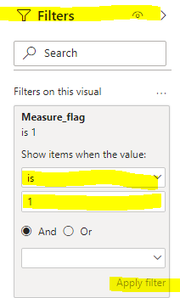
4. Take the [Top] column of the Slice table as the slicer, put measure[Measure_flag] into the Filter, and set is=1, apply filter.
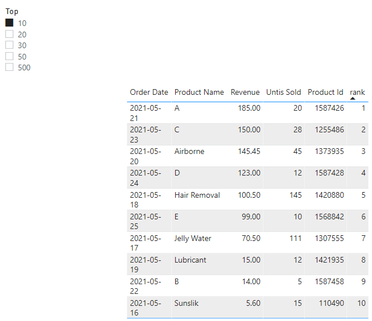
5. Result.
When 10 is selected, the top 10 data will be displayed:
When 20 is selected, the top 20 data will be displayed:
Best Regards,
Liu Yang
If this post helps, then please consider Accept it as the solution to help the other members find it more quickly.
- Mark as New
- Bookmark
- Subscribe
- Mute
- Subscribe to RSS Feed
- Permalink
- Report Inappropriate Content
Hi @Ashish_kumar12 ,
Here are the steps you can follow:
1. Create a table.
2. Create calculated column
rank = RANKX('Table','Table'[Revenue],,DESC)3. Create measure.
Flag =
var _top=SELECTEDVALUE(Slice[Top])
return
IF(MAX('Table'[rank])<=_top,1,0)
4. Set Sort by-rank and Sort ascending.
5. Take the [Top] column of the Slice table as the slicer, put measure[Flag] into the Filter, and set is=1, apply filter.
6. Result.
When 10 is selected, the top 10 data will be displayed:
When 20 is selected, the top 20 data will be displayed:
Best Regards,
Liu Yang
If this post helps, then please consider Accept it as the solution to help the other members find it more quickly.
- Mark as New
- Bookmark
- Subscribe
- Mute
- Subscribe to RSS Feed
- Permalink
- Report Inappropriate Content
Hi Liu,
Thank you so much for your response .
I tried the same measures which you have suggested and i got this error:
Also when i checked my Rank measure i got the same value in each row "1"
- Mark as New
- Bookmark
- Subscribe
- Mute
- Subscribe to RSS Feed
- Permalink
- Report Inappropriate Content
@Ashish_kumar12 , You can create TOPN with help from what if
example
measure =
var _n = selectedvalue(whatif[param])
return
CALCULATE([Revenue],TOPN(_n,allselected(Table[productsID]),[Revenue],DESC),VALUES(Table[productsID]))
refer
https://www.youtube.com/watch?v=UAnylK9bm1I
Microsoft Power BI Learning Resources, 2023 !!
Learn Power BI - Full Course with Dec-2022, with Window, Index, Offset, 100+ Topics !!
Did I answer your question? Mark my post as a solution! Appreciate your Kudos !! Proud to be a Super User! !!
- Mark as New
- Bookmark
- Subscribe
- Mute
- Subscribe to RSS Feed
- Permalink
- Report Inappropriate Content
Hi Amit ,
Thank you for your response .
I tried your method but it didn't work , so i found this :
https://www.youtube.com/watch?v=QtEt-QI3oe4
that's what i was looking for ,But thank you so much for your help
Regards
Ashish
Helpful resources

Microsoft Fabric Learn Together
Covering the world! 9:00-10:30 AM Sydney, 4:00-5:30 PM CET (Paris/Berlin), 7:00-8:30 PM Mexico City

Power BI Monthly Update - April 2024
Check out the April 2024 Power BI update to learn about new features.

| User | Count |
|---|---|
| 109 | |
| 98 | |
| 77 | |
| 66 | |
| 54 |
| User | Count |
|---|---|
| 144 | |
| 104 | |
| 100 | |
| 86 | |
| 64 |


