- Power BI forums
- Updates
- News & Announcements
- Get Help with Power BI
- Desktop
- Service
- Report Server
- Power Query
- Mobile Apps
- Developer
- DAX Commands and Tips
- Custom Visuals Development Discussion
- Health and Life Sciences
- Power BI Spanish forums
- Translated Spanish Desktop
- Power Platform Integration - Better Together!
- Power Platform Integrations (Read-only)
- Power Platform and Dynamics 365 Integrations (Read-only)
- Training and Consulting
- Instructor Led Training
- Dashboard in a Day for Women, by Women
- Galleries
- Community Connections & How-To Videos
- COVID-19 Data Stories Gallery
- Themes Gallery
- Data Stories Gallery
- R Script Showcase
- Webinars and Video Gallery
- Quick Measures Gallery
- 2021 MSBizAppsSummit Gallery
- 2020 MSBizAppsSummit Gallery
- 2019 MSBizAppsSummit Gallery
- Events
- Ideas
- Custom Visuals Ideas
- Issues
- Issues
- Events
- Upcoming Events
- Community Blog
- Power BI Community Blog
- Custom Visuals Community Blog
- Community Support
- Community Accounts & Registration
- Using the Community
- Community Feedback
Register now to learn Fabric in free live sessions led by the best Microsoft experts. From Apr 16 to May 9, in English and Spanish.
- Power BI forums
- Forums
- Get Help with Power BI
- Desktop
- Re: Tooltip on linecharts
- Subscribe to RSS Feed
- Mark Topic as New
- Mark Topic as Read
- Float this Topic for Current User
- Bookmark
- Subscribe
- Printer Friendly Page
- Mark as New
- Bookmark
- Subscribe
- Mute
- Subscribe to RSS Feed
- Permalink
- Report Inappropriate Content
Tooltip on linecharts
Hello,
I am trying to re-do a colleagues Dashboard. I have created a line chart, with > 10 lines showing. When creating a Tool tip, everything works fine, but it showes me all Information for every line on the X-Axis, where my Mouse is hovering.
I would like to have the tooltip filtered on the current line my mouse is hovered on.
Any Idea how to achieve that?
My Colleagues chart for some reason is doing that - but I cannot comprehend how he achieved that (he does not remember how it happened).
Any Help is appreciated = )
Solved! Go to Solution.
- Mark as New
- Bookmark
- Subscribe
- Mute
- Subscribe to RSS Feed
- Permalink
- Report Inappropriate Content
Hi @PhilippMer ,
Thanks for sharing the pbix file with me.
I checked the pbix file and was not able to identify why this is not working as the tooltip and your chart looks perfectly fine.
To check further, I thought why not try replicate this tab step-by-step to see where things are going wrong.
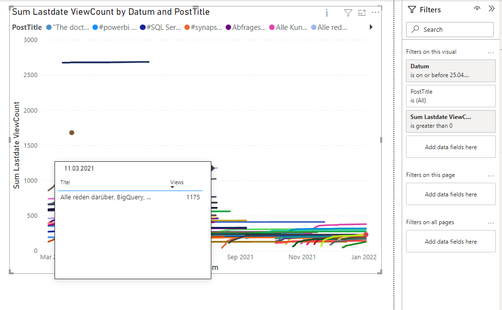
I created a new tab, Then replicated the same line chart and set-up the tooltip on it and it seems to work:
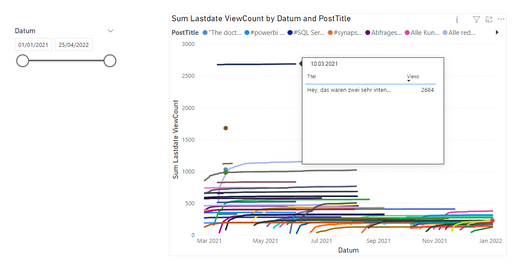
Now I added the slicers one-by-one like on your original tab. I started with DATE slicer and it works:
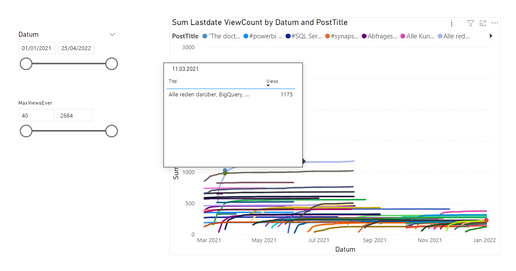
I added the 2nd slicer for the views count and it still semms to work:
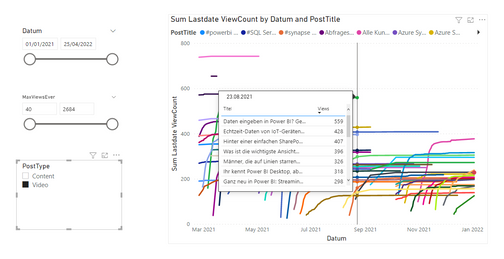
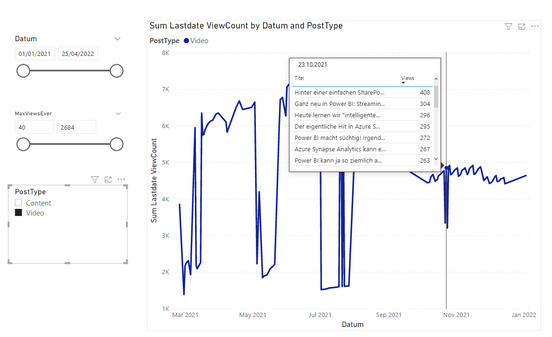
As soon as I add the slicer for Post Type, the tooltip doesn't work anymore:
One reason for this is:
Post type come from LinkedIn logs table, which has MANY-to-ONE relationship with LinkedIn Post tables from where the Post Text is coming. Basically for one Post Text value, you can have multiple Post Type values.
As soon as you select something in Post Type the tooltip gets filtered for only the selected Post Type value and shows all the Post Titles that have the selected Post Type values in the data. This makes sense to me.
So this is how why you see such behaviour on your tooltip.
One solution what I can suggest here is - Rather than moving Post Title to your legend section in Line chart, if you move Post Type in the legend section then this gives a better visibility on the information on the tooltip. Something like below:
Once you start selecting the post type slicer, you see that the tooltip shows all the post titles that have this post type in the tooltip:
So, based on the granularities you have in data this makes more sense to me. But this your data and you have better understanding of the usecase from business point of view on what is required here better than me.
Let me know if this works or there is a different usecase that you need to replicate here.
Apologies for coming back little late on this and such a long explanation, as I could not have explained it better than this.
- Mark as New
- Bookmark
- Subscribe
- Mute
- Subscribe to RSS Feed
- Permalink
- Report Inappropriate Content
Hi @PhilippMer ,
You can definitely achieve this by creating a custom tooltip on your report.
Something like below. Whenever I hover over a line, thr tooltip shows information only for that particular song genre like pop, rap, etc.
To get details on how to use custom tooltips on a Power BI report, check this article:
https://docs.microsoft.com/en-us/power-bi/create-reports/desktop-tooltips?tabs=powerbi-desktop
- Mark as New
- Bookmark
- Subscribe
- Mute
- Subscribe to RSS Feed
- Permalink
- Report Inappropriate Content
Thank you
- Mark as New
- Bookmark
- Subscribe
- Mute
- Subscribe to RSS Feed
- Permalink
- Report Inappropriate Content
Hello @Pragati11
Thank you very much for your help.
I already created a custom tooltip, should it automaticaly only show hovered values, or is that an extra setting?
In the documentation I did not find the necessary information so far.
- Mark as New
- Bookmark
- Subscribe
- Mute
- Subscribe to RSS Feed
- Permalink
- Report Inappropriate Content
HI @PhilippMer ,
Yes custom tooltip needs to be enabled on your visual and it should filter the shown info based on you hover in your main visual.
Can you share some screenshots around what is on your visual and what is on your custom tooltip?
Custom tooltip should always include the category that is shown as a line on your Line chart. Otherwise it won't filter it accordingly.
- Mark as New
- Bookmark
- Subscribe
- Mute
- Subscribe to RSS Feed
- Permalink
- Report Inappropriate Content
Hi @Pragati11 ,
thank you for your fast replies!
In the following picture is my linechart (Quite messy still) :
And here is my ToolTip:
My PowerBi is in German 😞
I manually added my ToolTip as the one for this linechart in its settings.
But if im not mistaken, the filters are correct?
Thanks in advance!
- Mark as New
- Bookmark
- Subscribe
- Mute
- Subscribe to RSS Feed
- Permalink
- Report Inappropriate Content
HI @PhilippMer ,
Are you moving PostTitle column in your custom tooltip which is represented as a line in your line chart?
- Mark as New
- Bookmark
- Subscribe
- Mute
- Subscribe to RSS Feed
- Permalink
- Report Inappropriate Content
Hi @Pragati11
I believe I do, not quite sure what you mean to be honest.
I attached another Screenshot.
So my Data Table in this Tooltip consists of the PostTitle column and the Views
Is this what you mean by "moving"?
- Mark as New
- Bookmark
- Subscribe
- Mute
- Subscribe to RSS Feed
- Permalink
- Report Inappropriate Content
HI @PhilippMer ,
Yes this what I meant by moving. This seems right and also you have moved postTitle column as a LEGEND on your line chart.
This should work technically as that's what I have done.
Are you moving the right Tooltip on your line chart?
I see in your earlier screenshot that you have used Post QuickInfo as a tooltip on your line chart. This is the right tooltip that you re referring above right?
- Mark as New
- Bookmark
- Subscribe
- Mute
- Subscribe to RSS Feed
- Permalink
- Report Inappropriate Content
Hi @Pragati11 ,
yes this is the ToolTip I am using on my Line Chart. I attached another Screenshot, just to make sure 🙂
"Berichtseite" means "Report page".
Hopefully you can spot, whatever I did wrong here...
Thank you!
- Mark as New
- Bookmark
- Subscribe
- Mute
- Subscribe to RSS Feed
- Permalink
- Report Inappropriate Content
HI @PhilippMer ,
This seems to be right.
Can you tell me another thing. On your line chart what granularity of date is moved in the x-axis?
You tooltip seems to show a particular day's views.
Can you check if the Date on line chart x-axis is at the day granularity:
If that's already the case, then can you share your pbix file with me by removing any sensitive data from it? You can share it via dropbox or WeTransfer.
- Mark as New
- Bookmark
- Subscribe
- Mute
- Subscribe to RSS Feed
- Permalink
- Report Inappropriate Content
Hi @Pragati11
thank you for all your effort!
My LineChart was set to the correct format...
I would then proceed to send it to you via DropBox.
Thank you so much for your time!
- Mark as New
- Bookmark
- Subscribe
- Mute
- Subscribe to RSS Feed
- Permalink
- Report Inappropriate Content
- Mark as New
- Bookmark
- Subscribe
- Mute
- Subscribe to RSS Feed
- Permalink
- Report Inappropriate Content
Hi @PhilippMer ,
Thanks for sharing the pbix file with me.
I checked the pbix file and was not able to identify why this is not working as the tooltip and your chart looks perfectly fine.
To check further, I thought why not try replicate this tab step-by-step to see where things are going wrong.
I created a new tab, Then replicated the same line chart and set-up the tooltip on it and it seems to work:
Now I added the slicers one-by-one like on your original tab. I started with DATE slicer and it works:
I added the 2nd slicer for the views count and it still semms to work:
As soon as I add the slicer for Post Type, the tooltip doesn't work anymore:
One reason for this is:
Post type come from LinkedIn logs table, which has MANY-to-ONE relationship with LinkedIn Post tables from where the Post Text is coming. Basically for one Post Text value, you can have multiple Post Type values.
As soon as you select something in Post Type the tooltip gets filtered for only the selected Post Type value and shows all the Post Titles that have the selected Post Type values in the data. This makes sense to me.
So this is how why you see such behaviour on your tooltip.
One solution what I can suggest here is - Rather than moving Post Title to your legend section in Line chart, if you move Post Type in the legend section then this gives a better visibility on the information on the tooltip. Something like below:
Once you start selecting the post type slicer, you see that the tooltip shows all the post titles that have this post type in the tooltip:
So, based on the granularities you have in data this makes more sense to me. But this your data and you have better understanding of the usecase from business point of view on what is required here better than me.
Let me know if this works or there is a different usecase that you need to replicate here.
Apologies for coming back little late on this and such a long explanation, as I could not have explained it better than this.
- Mark as New
- Bookmark
- Subscribe
- Mute
- Subscribe to RSS Feed
- Permalink
- Report Inappropriate Content
Hello @Pragati11
Could you privde your pbix file with your solution?
I'm traying to do the same as @PhilippMer: line chart and custom tooltip. I had column in line chart to be Legend and it is not filtering data in custom tooltip when I hoover over one of lines in line chart.
Documentations says it can't be done: https://community.fabric.microsoft.com/t5/Desktop/Tooltip-on-linecharts/td-p/2569001
I'm wondering how you managed to work it.
- Mark as New
- Bookmark
- Subscribe
- Mute
- Subscribe to RSS Feed
- Permalink
- Report Inappropriate Content
Hello @Pragati11 ,
thank you so much for your time and effort. I couldnt get my head around this porblem.
This solution helped me out alot!
- Mark as New
- Bookmark
- Subscribe
- Mute
- Subscribe to RSS Feed
- Permalink
- Report Inappropriate Content
- Mark as New
- Bookmark
- Subscribe
- Mute
- Subscribe to RSS Feed
- Permalink
- Report Inappropriate Content
Helpful resources

Microsoft Fabric Learn Together
Covering the world! 9:00-10:30 AM Sydney, 4:00-5:30 PM CET (Paris/Berlin), 7:00-8:30 PM Mexico City

Power BI Monthly Update - April 2024
Check out the April 2024 Power BI update to learn about new features.

| User | Count |
|---|---|
| 107 | |
| 100 | |
| 78 | |
| 64 | |
| 58 |
| User | Count |
|---|---|
| 148 | |
| 113 | |
| 97 | |
| 84 | |
| 67 |
