- Power BI forums
- Updates
- News & Announcements
- Get Help with Power BI
- Desktop
- Service
- Report Server
- Power Query
- Mobile Apps
- Developer
- DAX Commands and Tips
- Custom Visuals Development Discussion
- Health and Life Sciences
- Power BI Spanish forums
- Translated Spanish Desktop
- Power Platform Integration - Better Together!
- Power Platform Integrations (Read-only)
- Power Platform and Dynamics 365 Integrations (Read-only)
- Training and Consulting
- Instructor Led Training
- Dashboard in a Day for Women, by Women
- Galleries
- Community Connections & How-To Videos
- COVID-19 Data Stories Gallery
- Themes Gallery
- Data Stories Gallery
- R Script Showcase
- Webinars and Video Gallery
- Quick Measures Gallery
- 2021 MSBizAppsSummit Gallery
- 2020 MSBizAppsSummit Gallery
- 2019 MSBizAppsSummit Gallery
- Events
- Ideas
- Custom Visuals Ideas
- Issues
- Issues
- Events
- Upcoming Events
- Community Blog
- Power BI Community Blog
- Custom Visuals Community Blog
- Community Support
- Community Accounts & Registration
- Using the Community
- Community Feedback
Register now to learn Fabric in free live sessions led by the best Microsoft experts. From Apr 16 to May 9, in English and Spanish.
- Power BI forums
- Forums
- Get Help with Power BI
- Desktop
- Re: Time Intelligence in Power BI with Buttons
- Subscribe to RSS Feed
- Mark Topic as New
- Mark Topic as Read
- Float this Topic for Current User
- Bookmark
- Subscribe
- Printer Friendly Page
- Mark as New
- Bookmark
- Subscribe
- Mute
- Subscribe to RSS Feed
- Permalink
- Report Inappropriate Content
Time Intelligence in Power BI with Buttons
Hi,
I am wondering how to create three buttons (1mo vs 1mo, 3mo vs 3mo, and 12mo vs 12mo) so the user can make a selection and see the visuals update across the entire report.
I am having a tough time understanding how to make this work. I am currently using a relative date filter to display information in the month of June. Then I am using the date add function to compare June to the month of May.
The goal is for the user to have the ability to display the most recently completed one-month periods (June vs. May), three-month periods (June, May, April (current period) vs. March, January, and February (previous period), and 12mo periods to each other (June, May, April, March, February, January, December, November, October, September, August, July (current period) vs. (June, May, April, March, February, January, December, November, October, September, August, July (previous period) by making a selection from one of the three buttons at the top of the report.
I am finding the comparison relatively simple to do when the visuals are only showing one period, such as a 1-month comparison (June vs. May), but where I am becoming confused is how the visuals can be updated to a 3mo comparison or a 12mo comparison by selecting a button for that period, instead of having to change out the measure manually every time a new time comparison is requested.
The reason why I am saying 1mo period, 3mo period, and 12mo period instead of month, quarter, and year is because the dates are rolling, so the current period will always be the most recently completed month, three months or 12 months. I am using the relative date filter to achieve this at the moment where I specify "Show items when the value is in the last 1 calendar month" (for month vs month), "3 calendar months" (for 3mo vs. 3mo), and "12 calendar months" for (12mo vs. 12mo). When I use this method, I must change the filter and measure when I would like to go from 1mo vs. 1mo to 3mo vs. 3mo, to 12mo vs. 12mo. This way does work, and it will only show a comparison between the most recently completed month (June vs May), 3 months (June, May, April (current period) vs. March, January, and February (previous period), or 12 months, but I am wondering how the visuals can be updated automatically to display the same information, but by selecting a button at the top of the report instead of having to change the measure each time I would like to make a different time comparison.
TIA!
Solved! Go to Solution.
- Mark as New
- Bookmark
- Subscribe
- Mute
- Subscribe to RSS Feed
- Permalink
- Report Inappropriate Content
Hi Everyone,
Here is the solution that I have found to work. I hope someone finds this useful. I will give credit to the freelancer who came up with this at the end of the post.
End Result:
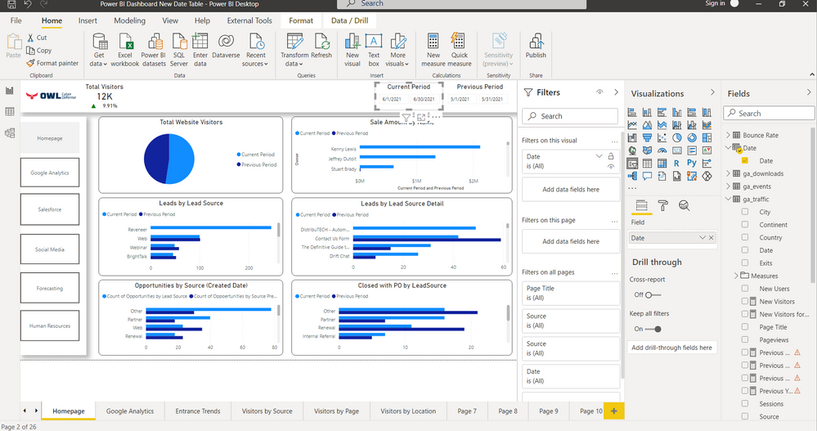
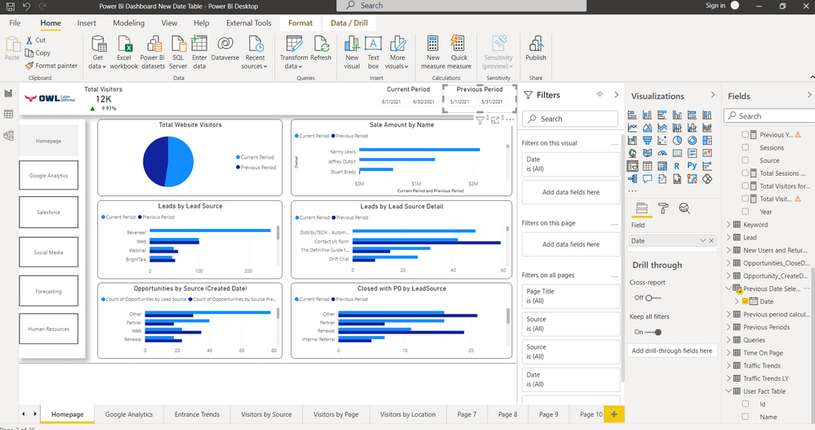
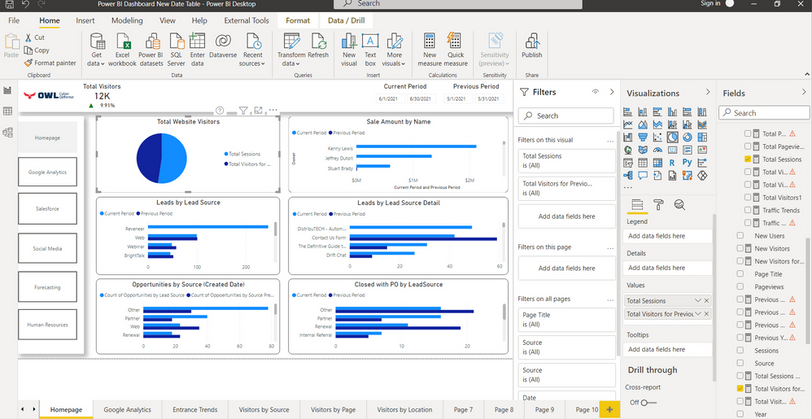
You will have one slicer for the current period and one slicer for the previous period. You can compare any range of dates to one another by selecting your date range in the corresponding slicer. In the photo below the current period slicer is showing 6/1/2021-6/30/2021 and the previous period slicer is showing 5/1/2021-5/31/2021. The light blue line is showing the current period and the dark blue line is showing the previous period in the visuals.
Step 1:
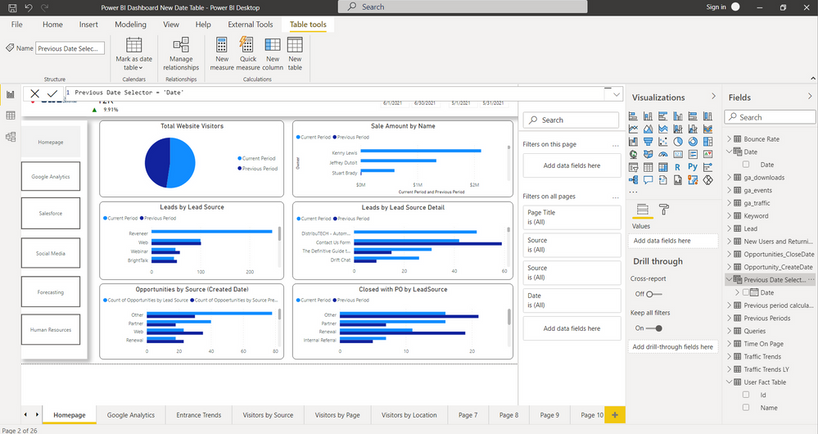
Create a new measure called "Previous Date Selector" and use your date table as the parameter value.
Step 2:
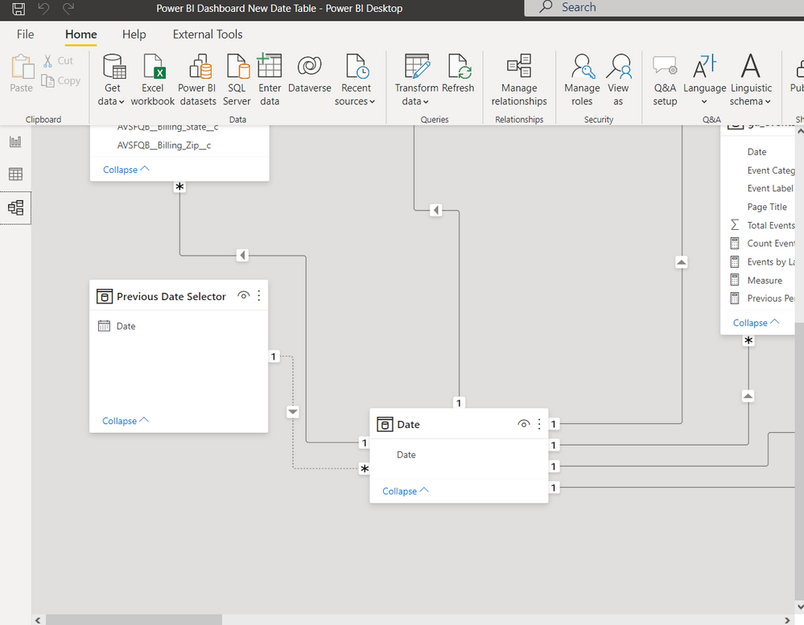
Create an inactive one too many relationship between your "Previous Date Selector" and regular date table.
Step 3:
Create a slicer from your standard date table and name it "current period" and create a slicer from your "previous date selector" and name it "previous period."
Step 4:
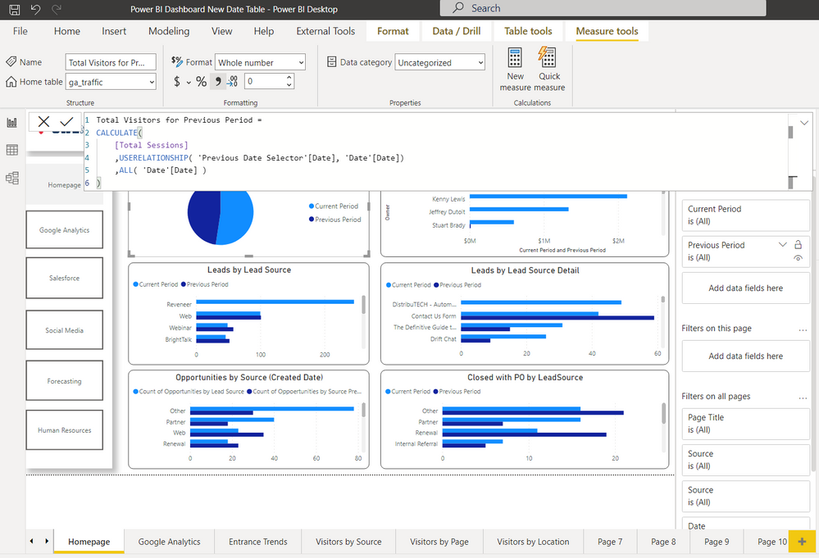
Create a measure with the following dax. In this case, I am comparing total sessions in the current period to total sessions in the previous period so I am using the "total sessions" value.
Step 5
Add your two values to the visual you would like to use to compare the current period to the previous period. In this case, I am comparing total sessions from google analytics so I have a measure for "total sessions", which is synched to the current period slicer and a measure for "total visitors for previous period", which is synched to the previous period slicer.
I hope this helps someone!
Freelancer: andystepas | Profile | Fiverr
- Mark as New
- Bookmark
- Subscribe
- Mute
- Subscribe to RSS Feed
- Permalink
- Report Inappropriate Content
The simplest way to do that (assuming your have your 3 DAX expressions to get 1, 3, and 12 mo comparisons) would be to make a calculation group. You could then put the calc group in a slicer so the user could choose the time frame to compare.
If you really need buttons, you can do that with bookmarks and make 3 versions of the visual that overlap and set up the bookmarks with only one version showing at a time.
Pat
Did I answer your question? Mark my post as a solution! Kudos are also appreciated!
To learn more about Power BI, follow me on Twitter or subscribe on YouTube.
@mahoneypa HoosierBI on YouTube
- Mark as New
- Bookmark
- Subscribe
- Mute
- Subscribe to RSS Feed
- Permalink
- Report Inappropriate Content
Hi @mahoneypat
thank you for the response.
If you think the solution that is posted above is useful please consider accepting it as a solution.
Thank you,
Joshua Cortigiano
Helpful resources

Microsoft Fabric Learn Together
Covering the world! 9:00-10:30 AM Sydney, 4:00-5:30 PM CET (Paris/Berlin), 7:00-8:30 PM Mexico City

Power BI Monthly Update - April 2024
Check out the April 2024 Power BI update to learn about new features.

| User | Count |
|---|---|
| 117 | |
| 105 | |
| 69 | |
| 67 | |
| 43 |
| User | Count |
|---|---|
| 148 | |
| 103 | |
| 103 | |
| 88 | |
| 66 |

