- Power BI forums
- Updates
- News & Announcements
- Get Help with Power BI
- Desktop
- Service
- Report Server
- Power Query
- Mobile Apps
- Developer
- DAX Commands and Tips
- Custom Visuals Development Discussion
- Health and Life Sciences
- Power BI Spanish forums
- Translated Spanish Desktop
- Power Platform Integration - Better Together!
- Power Platform Integrations (Read-only)
- Power Platform and Dynamics 365 Integrations (Read-only)
- Training and Consulting
- Instructor Led Training
- Dashboard in a Day for Women, by Women
- Galleries
- Community Connections & How-To Videos
- COVID-19 Data Stories Gallery
- Themes Gallery
- Data Stories Gallery
- R Script Showcase
- Webinars and Video Gallery
- Quick Measures Gallery
- 2021 MSBizAppsSummit Gallery
- 2020 MSBizAppsSummit Gallery
- 2019 MSBizAppsSummit Gallery
- Events
- Ideas
- Custom Visuals Ideas
- Issues
- Issues
- Events
- Upcoming Events
- Community Blog
- Power BI Community Blog
- Custom Visuals Community Blog
- Community Support
- Community Accounts & Registration
- Using the Community
- Community Feedback
Register now to learn Fabric in free live sessions led by the best Microsoft experts. From Apr 16 to May 9, in English and Spanish.
- Power BI forums
- Forums
- Get Help with Power BI
- Desktop
- The data in my report is somehow different than it...
- Subscribe to RSS Feed
- Mark Topic as New
- Mark Topic as Read
- Float this Topic for Current User
- Bookmark
- Subscribe
- Printer Friendly Page
- Mark as New
- Bookmark
- Subscribe
- Mute
- Subscribe to RSS Feed
- Permalink
- Report Inappropriate Content
The data in my report is somehow different than it is in Power Query?
Hi Guys,
Forgive me if I'm being stupid, but never before have I came across this issue with Power BI and I can't figure out what the problem is.
So, I have created 3 conditional columns (Severity Number, Impact Number and RAG Score) in Power Query as per below
Then when I close and load the data, these are the results I'm getting in my tables and visuals:
No further calculations were done, I have cleared my cache and refreshed everything in both Power Query and in the report view and still, these numbers are somehow changing from 5, 5 and 25, to 15, 15 and 75. Anyone know what I am doing wrong as I am baffled?
Thanks in advance!
Solved! Go to Solution.
- Mark as New
- Bookmark
- Subscribe
- Mute
- Subscribe to RSS Feed
- Permalink
- Report Inappropriate Content
hi @P8MCP ,
I guess you have 3 records (possibly duplicate) for NSP-840 in your source file. Hence after load, the numbers are getting aggregated. If that's not the case, I would try to define the Severtiry number as Text (as the output format in calculation) and later convert to number if required.
Best Luck!
Regards!
- Mark as New
- Bookmark
- Subscribe
- Mute
- Subscribe to RSS Feed
- Permalink
- Report Inappropriate Content
- Mark as New
- Bookmark
- Subscribe
- Mute
- Subscribe to RSS Feed
- Permalink
- Report Inappropriate Content
hi @alekhved
Sure of course. So the data I have for Severity and Impact is structured like this in the source "1 - Very Low", "2 - Low", "3 - Medium" etc.
So for both the "Severity Number" and "Impact Number" columns, I have extracted the numbers to do my calculations as per below:
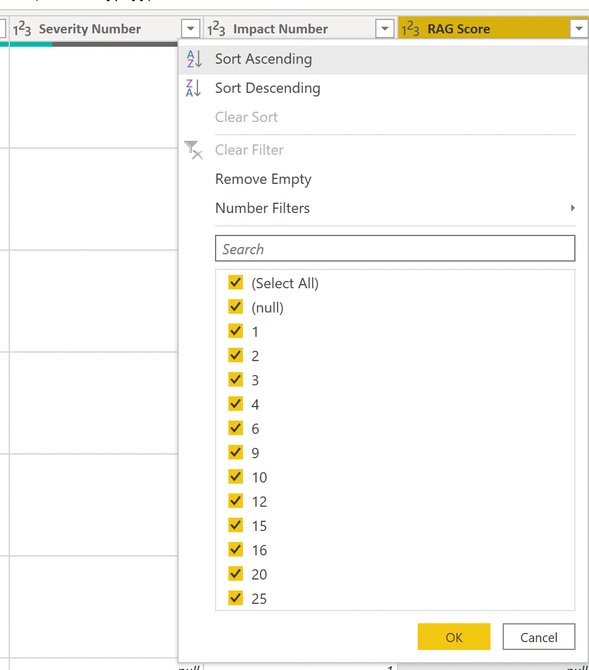
Then the RAG Score is a simple multiplication of both of these columns together. In Power Query my results looks perfect, with nothing scoring over 25 (as it should be) which can be seen below:
These are the last steps in my Power Query so nothing else has been done after this, yet my results are still different when loaded 😞
- Mark as New
- Bookmark
- Subscribe
- Mute
- Subscribe to RSS Feed
- Permalink
- Report Inappropriate Content
hi @P8MCP ,
I guess you have 3 records (possibly duplicate) for NSP-840 in your source file. Hence after load, the numbers are getting aggregated. If that's not the case, I would try to define the Severtiry number as Text (as the output format in calculation) and later convert to number if required.
Best Luck!
Regards!
- Mark as New
- Bookmark
- Subscribe
- Mute
- Subscribe to RSS Feed
- Permalink
- Report Inappropriate Content
Hi @alekhved
Accepting this as the solution as defining the Severity and Impact as Text done the trick. I've been developing on Power BI for 3 years and never knew this could happen, nor do I understand why 🙃 but hey ho. Thanks so much you've really helped me out for going into the new working week!
Helpful resources

Microsoft Fabric Learn Together
Covering the world! 9:00-10:30 AM Sydney, 4:00-5:30 PM CET (Paris/Berlin), 7:00-8:30 PM Mexico City

Power BI Monthly Update - April 2024
Check out the April 2024 Power BI update to learn about new features.

| User | Count |
|---|---|
| 109 | |
| 98 | |
| 77 | |
| 66 | |
| 54 |
| User | Count |
|---|---|
| 144 | |
| 104 | |
| 101 | |
| 86 | |
| 64 |


