- Power BI forums
- Updates
- News & Announcements
- Get Help with Power BI
- Desktop
- Service
- Report Server
- Power Query
- Mobile Apps
- Developer
- DAX Commands and Tips
- Custom Visuals Development Discussion
- Health and Life Sciences
- Power BI Spanish forums
- Translated Spanish Desktop
- Power Platform Integration - Better Together!
- Power Platform Integrations (Read-only)
- Power Platform and Dynamics 365 Integrations (Read-only)
- Training and Consulting
- Instructor Led Training
- Dashboard in a Day for Women, by Women
- Galleries
- Community Connections & How-To Videos
- COVID-19 Data Stories Gallery
- Themes Gallery
- Data Stories Gallery
- R Script Showcase
- Webinars and Video Gallery
- Quick Measures Gallery
- 2021 MSBizAppsSummit Gallery
- 2020 MSBizAppsSummit Gallery
- 2019 MSBizAppsSummit Gallery
- Events
- Ideas
- Custom Visuals Ideas
- Issues
- Issues
- Events
- Upcoming Events
- Community Blog
- Power BI Community Blog
- Custom Visuals Community Blog
- Community Support
- Community Accounts & Registration
- Using the Community
- Community Feedback
Register now to learn Fabric in free live sessions led by the best Microsoft experts. From Apr 16 to May 9, in English and Spanish.
- Power BI forums
- Forums
- Get Help with Power BI
- Desktop
- Team Averages and Frequency Help
- Subscribe to RSS Feed
- Mark Topic as New
- Mark Topic as Read
- Float this Topic for Current User
- Bookmark
- Subscribe
- Printer Friendly Page
- Mark as New
- Bookmark
- Subscribe
- Mute
- Subscribe to RSS Feed
- Permalink
- Report Inappropriate Content
Team Averages and Frequency Help
Hello
I'm new to Power BI so please forgive me if I'm a little oblivious. Also I apologise but due to the nature of the work I am unable to share any direct data and have had to alter some of the information below to anonymise things. If I have done too poor a job of explaining the situation and outcomes required I will get to work putting together a mock sample for anyone who can spare some time.
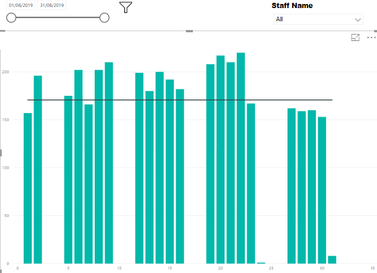
I have a spreadsheet of worklogs submitted by staff from two different teams with over 5000 entries each month. I am trying to create a line and stacked column chart that will show the number of worklogs submitted each day with a line for the daily average and adding a slicer to filter through the different members of staff who have made a submission. Something similar to the below:
I currently have 3 tables set up:
- Team Worklog Data - CSV data of all the worklog submissions, 5000+ rows, 15 columns including names, dates and type of work. I have added a calculated column in here to display team name of the user for other purposes.
- Staff List - list of all staff who use the worklog and the corresponding team they work for
- Count of Worklogs - table with caluclated columns to get a daily breakdown of the worklogs submitted
Calculated column1 =
Daily Worklog Count = SUMMARIZECOLUMNS(
'Team Worklog Data'[date created],
"Daily Worklog Count",count('Team Worklog Data'[workcompleted])
)
Calculated column2 =
Average Daily Worklog Count = 'Count of worklogs'[Daily Worklog Count]/(calculate(countrows('Staff List'),filter('Staff List', 'Staff List'[Team]="Team 1")))
The measures I'm using for this are:
" Total Work = Count('Table1' [workcompleted]) "
Column Values: " Team1 Total work = calculate([total work], 'Table1'[TeamNo]="Team1") "
Line Values: " Average Daily Worklog Count = 'Count of Daily Worklogs'[Total Daily Count]/(calculate(countrows('Staff List'),filter('Staff List', 'Staff List'[Team]="Team1")))
I'm having a lot of difficulty trying to get the line value correct for the above graph. The value I am using now includes both teams, while I only want Team1 to be included. I suspect I'm missing something obvious and easy here for how to filter what I already have to only include 'team1'? Would there be an easy way to make this dynamic for the days and not just an average for the month?
The other question I had is for the simplest way to count and tabulate the number of days staff submitted a worklog, bearing in mind they will have submitted multiple worklogs each day. For some context the sum/frequency formula I would use for this in excel was:
=SUM(--(FREQUENCY(IF(F1:F100=A1,MATCH(T1:T100,T1:T100,0)),ROW(T1:T100)-ROW(T1)+1)>0))
I understand this is easily achieved with visuals and slicers/filters etc but I need this in a data/table format so that it can be used for further calculations.
Thank you in advance for any help/advice you can offer, sorry for the long post and potentially countless confusing errors included above!
Solved! Go to Solution.
- Mark as New
- Bookmark
- Subscribe
- Mute
- Subscribe to RSS Feed
- Permalink
- Report Inappropriate Content
@Anonymous
You may try using AVERAGEX and SUMX.
- https://www.sqlbi.com/articles/summing-values-for-the-total/
- https://www.sqlbi.com/articles/filter-arguments-in-calculate/
If this post helps, then please consider Accept it as the solution to help the other members find it more quickly.
Helpful resources

Microsoft Fabric Learn Together
Covering the world! 9:00-10:30 AM Sydney, 4:00-5:30 PM CET (Paris/Berlin), 7:00-8:30 PM Mexico City

Power BI Monthly Update - April 2024
Check out the April 2024 Power BI update to learn about new features.

| User | Count |
|---|---|
| 114 | |
| 100 | |
| 78 | |
| 75 | |
| 52 |
| User | Count |
|---|---|
| 144 | |
| 109 | |
| 108 | |
| 88 | |
| 61 |

