- Power BI forums
- Updates
- News & Announcements
- Get Help with Power BI
- Desktop
- Service
- Report Server
- Power Query
- Mobile Apps
- Developer
- DAX Commands and Tips
- Custom Visuals Development Discussion
- Health and Life Sciences
- Power BI Spanish forums
- Translated Spanish Desktop
- Power Platform Integration - Better Together!
- Power Platform Integrations (Read-only)
- Power Platform and Dynamics 365 Integrations (Read-only)
- Training and Consulting
- Instructor Led Training
- Dashboard in a Day for Women, by Women
- Galleries
- Community Connections & How-To Videos
- COVID-19 Data Stories Gallery
- Themes Gallery
- Data Stories Gallery
- R Script Showcase
- Webinars and Video Gallery
- Quick Measures Gallery
- 2021 MSBizAppsSummit Gallery
- 2020 MSBizAppsSummit Gallery
- 2019 MSBizAppsSummit Gallery
- Events
- Ideas
- Custom Visuals Ideas
- Issues
- Issues
- Events
- Upcoming Events
- Community Blog
- Power BI Community Blog
- Custom Visuals Community Blog
- Community Support
- Community Accounts & Registration
- Using the Community
- Community Feedback
Register now to learn Fabric in free live sessions led by the best Microsoft experts. From Apr 16 to May 9, in English and Spanish.
- Power BI forums
- Forums
- Get Help with Power BI
- Desktop
- Re: TRICKY - Rolling 12 months Measure error
- Subscribe to RSS Feed
- Mark Topic as New
- Mark Topic as Read
- Float this Topic for Current User
- Bookmark
- Subscribe
- Printer Friendly Page
- Mark as New
- Bookmark
- Subscribe
- Mute
- Subscribe to RSS Feed
- Permalink
- Report Inappropriate Content
TRICKY - Rolling 12 months Measure error
Hi Experts
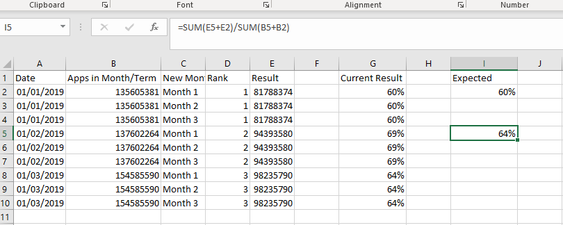
I cannot work out where i am going wrong with the following rolling 12 months measure. See calculate column measure.
For Jan 19 The result is correct 60%
For Feb 19 The result is worng and should be the Sum of (81,788,374+94393580) / (135,605,381 + 137602264) = 64%
not (94393580) / (137602264) which the measure is returning.
See expected result in excel image
Sample PBIX File
https://www.dropbox.com/s/6uqpevfaqhxy0ye/sAMPLE.pbix?dl=0
Solved! Go to Solution.
- Mark as New
- Bookmark
- Subscribe
- Mute
- Subscribe to RSS Feed
- Permalink
- Report Inappropriate Content
This column expression seems to work but two questions. Why not do this as a measure instead? And is there a better way to model your data, to avoid having all the duplicate values in your table?
New column =
VAR enddate = Llo_DIR_Data[Date]
VAR startdate =
EOMONTH ( enddate, -6 ) + 1
VAR result =
CALCULATE (
AVERAGEX (
DISTINCT ( Llo_DIR_Data[Date] ),
CALCULATE (
DIVIDE (
AVERAGE ( Llo_DIR_Data[Result] ),
AVERAGE ( Llo_DIR_Data[Apps in Month/Term] )
)
)
),
ALL ( Llo_DIR_Data ),
FILTER (
ALL ( Llo_DIR_Data[Date] ),
Llo_DIR_Data[Date] >= startdate
&& Llo_DIR_Data[Date] <= enddate
)
)
RETURN
result
Pat
Did I answer your question? Mark my post as a solution! Kudos are also appreciated!
To learn more about Power BI, follow me on Twitter or subscribe on YouTube.
@mahoneypa HoosierBI on YouTube
- Mark as New
- Bookmark
- Subscribe
- Mute
- Subscribe to RSS Feed
- Permalink
- Report Inappropriate Content
Many thanks Pat,
Helpful resources

Microsoft Fabric Learn Together
Covering the world! 9:00-10:30 AM Sydney, 4:00-5:30 PM CET (Paris/Berlin), 7:00-8:30 PM Mexico City

Power BI Monthly Update - April 2024
Check out the April 2024 Power BI update to learn about new features.

| User | Count |
|---|---|
| 107 | |
| 100 | |
| 78 | |
| 64 | |
| 58 |
| User | Count |
|---|---|
| 148 | |
| 113 | |
| 97 | |
| 84 | |
| 67 |

