cancel
Showing results for 
Search instead for 
Did you mean: 

Register now to learn Fabric in free live sessions led by the best Microsoft experts. From Apr 16 to May 9, in English and Spanish.

Reply
Anonymous
Not applicable

Summarize multiple columns based on values

I am stuck with an issue I cant seem to figure out how to do in DAX.  Since users will select filters in PowerBI Services, I can't do this in Power Query/M as some materials would be filtered out and would require a change to the summary result table.  Any assistance would be appreciated.


I have a set of data like below (but with many more rules & materials)


Material   Rule-1  Rule-2 Rule-3

A                 Pass  Fail       N/A

B                  Fail   Pass    Pass

C                  N/A  Fail     Pass


And I want to create a table like 


Status  Rule-1 Rule-2 Rule-3

Pass       1          1          2

Fail         1          2          0

N/A        1          0          1


or it could be pivoted (rules down left and Pass, Fail, N/A across top) does not matter.


How would I accomplish this?

4 REPLIES 4
moumipanja
Employee
Employee

To unpivot a table using DAX is quite challenging. You may want to try the following steps in DAX to get your desired result.


1. Creating a new table with two columns, 'Rules' and 'Status'

new table = UNION(
SELECTCOLUMNS(Sheet2, "Status", Sheet2[Rule 1], "Rules", "Rule 1"),
SELECTCOLUMNS(Sheet2, "Status", Sheet2[Rule 2], "Rules", "Rule 2"),
SELECTCOLUMNS(Sheet2, "Status", Sheet2[Rule 3], "Rules", "Rule 3"))
 
You will be able to get a table like this:
1.JPG
 
2. Then you can use a matrix format to display your result
1.JPG
Anonymous
Not applicable

Sorry for confussion, but I need to create a summary table in DAX, because i am pushing to R which is limited to 150,000 rows and my data set is 3 million records and increasing.  So, i cant use a widget (like a matrix) to summarize the data.

Hi @Anonymous,


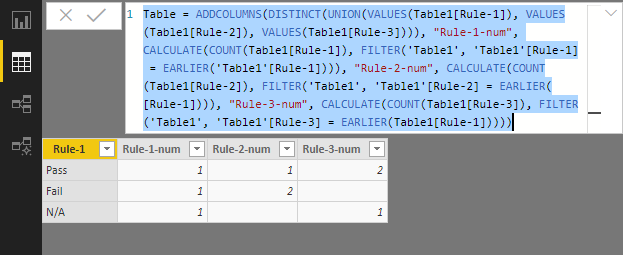
You can get it with the formula below. But this calculated table is relative stable, which means its values can't change as the filters or slicers change.

Table =
ADDCOLUMNS (
    DISTINCT (
        UNION (
            VALUES ( Table1[Rule-1] ),
            VALUES ( Table1[Rule-2] ),
            VALUES ( Table1[Rule-3] )
        )
    ),
    "Rule-1-num", CALCULATE (
        COUNT ( Table1[Rule-1] ),
        FILTER ( 'Table1', 'Table1'[Rule-1] = EARLIER ( 'Table1'[Rule-1] ) )
    ),
    "Rule-2-num", CALCULATE (
        COUNT ( Table1[Rule-2] ),
        FILTER ( 'Table1', 'Table1'[Rule-2] = EARLIER ( [Rule-1] ) )
    ),
    "Rule-3-num", CALCULATE (
        COUNT ( Table1[Rule-3] ),
        FILTER ( 'Table1', 'Table1'[Rule-3] = EARLIER ( Table1[Rule-1] ) )
    )
)

Summarize-multiple-columns-based-on-values


Best Regards,

Community Support Team _ Dale
If this post helps, then please consider Accept it as the solution to help the other members find it more quickly.
Anonymous
Not applicable

I was able to get your solution to work, but as you mentioned when a user filters with a slicer the summary table does not update.  This update is a key feature for my solution.  Is there no way to create a table in dax that is updateable based on user selections?

Helpful resources

Announcements
Microsoft Fabric Learn Together

Microsoft Fabric Learn Together

Covering the world! 9:00-10:30 AM Sydney, 4:00-5:30 PM CET (Paris/Berlin), 7:00-8:30 PM Mexico City

PBI_APRIL_CAROUSEL1

Power BI Monthly Update - April 2024

Check out the April 2024 Power BI update to learn about new features.

April Fabric Community Update

Fabric Community Update - April 2024

Find out what's new and trending in the Fabric Community.