Hello everyone
I wonder if anyone can help me with thisproblem. Basically I have a list with 4 columns, in the first I have names, in the second are some of the names that are in the second (some of them may be blank, in the third is the month of creation and the last is the month resolved.
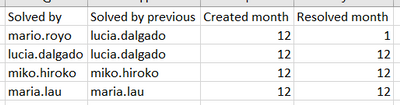
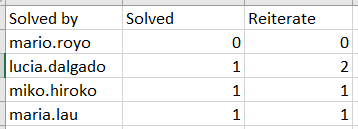
What I want to achieve is a summary of the first table:
In the column
Resolved I used the number of accounts (table1)resolved by the number (table2)resolved by AND (table1)resolved month 12
Reiterates that I used the month of accounts (table1) resolved by the previous month (table2) resolved by AND (table1)created month 12
I used the SUMMARIZE formula in powerbi*
I have this:
Table: SUMMARIZE('Faults','Failures'[Resolved by],"Failures",CALCULATE(COUNTROWS(FILTER('Failures','Failures'[Resolution Month]-"Dec-20"))),"Repeat",CALCULATE(COUNTROWS(FILTER('Failures','Failures'[Creation Month]-"Dec-20"))))
but I don't know how to filter the second row "Repeat" by Resolved by previous
Any help is highly appreciated. Thanks a lot
Edit: I used this formulas in PowerBi
Solved = COUNTROWS(FILTER('Table1','Table1'[Solved by]='Table1'[Solved by] && 'Table1'[resolutiondate] >= MIN('Date'[Date]) && 'Table1'[resolutiondate] <= MAX('Date'[Date])))
Reiterate = COUNTROWS(FILTER('Table1', 'Table1'[Solved by previous]='Table1'[Solved by previous] && 'Table1'[createddate] >= MIN('Date'[Date]) && 'Table1'[createddate] <= MAX('Date'[Date])))
The problem that I have is with the second formula, when I put it on a matrix it classifies it only with respect to solved by and not solved by previous. Any help is really appreciated. Thanks a lot.


