- Power BI forums
- Updates
- News & Announcements
- Get Help with Power BI
- Desktop
- Service
- Report Server
- Power Query
- Mobile Apps
- Developer
- DAX Commands and Tips
- Custom Visuals Development Discussion
- Health and Life Sciences
- Power BI Spanish forums
- Translated Spanish Desktop
- Power Platform Integration - Better Together!
- Power Platform Integrations (Read-only)
- Power Platform and Dynamics 365 Integrations (Read-only)
- Training and Consulting
- Instructor Led Training
- Dashboard in a Day for Women, by Women
- Galleries
- Community Connections & How-To Videos
- COVID-19 Data Stories Gallery
- Themes Gallery
- Data Stories Gallery
- R Script Showcase
- Webinars and Video Gallery
- Quick Measures Gallery
- 2021 MSBizAppsSummit Gallery
- 2020 MSBizAppsSummit Gallery
- 2019 MSBizAppsSummit Gallery
- Events
- Ideas
- Custom Visuals Ideas
- Issues
- Issues
- Events
- Upcoming Events
- Community Blog
- Power BI Community Blog
- Custom Visuals Community Blog
- Community Support
- Community Accounts & Registration
- Using the Community
- Community Feedback
Register now to learn Fabric in free live sessions led by the best Microsoft experts. From Apr 16 to May 9, in English and Spanish.
- Power BI forums
- Forums
- Get Help with Power BI
- Desktop
- Re: Sum by Individual Selection and Sum by Group
- Subscribe to RSS Feed
- Mark Topic as New
- Mark Topic as Read
- Float this Topic for Current User
- Bookmark
- Subscribe
- Printer Friendly Page
- Mark as New
- Bookmark
- Subscribe
- Mute
- Subscribe to RSS Feed
- Permalink
- Report Inappropriate Content
Sum by Individual Selection and Sum by Group
Hello,
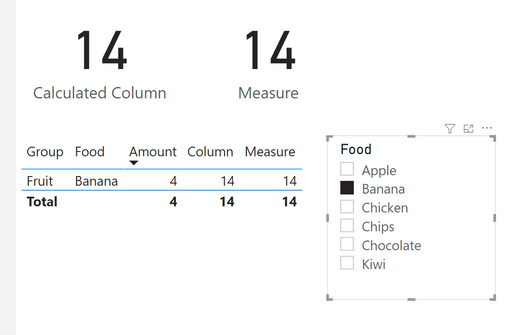
I'm trying to show a dash that is built on the food slicer. Once the food is selected, I'd like to display the amount of that specific food and the amount in the specific group. For example, if I select Apple - I would like the 3 for the amount of apples and 14 for the amount of fruit total to display. What DAX would have to be used to update the group based on the food selection? Similarly, if I change the slicer to Chips, the amount for chips updates correctly to 2, but what DAX would I use to have the group automatically be updated to Snack and show the total of 3?
Thank you!
| Food | Group | Amount |
| Apple | Fruit | 3 |
| Banana | Fruit | 4 |
| Kiwi | Fruit | 7 |
| Chips | Snack | 2 |
| Chocolate | Snack | 1 |
| Chicken | Meat | 9 |
Solved! Go to Solution.
- Mark as New
- Bookmark
- Subscribe
- Mute
- Subscribe to RSS Feed
- Permalink
- Report Inappropriate Content
@kamil947, apologies. I misread the part that you wanted the "Sum of Group" in the other Card.
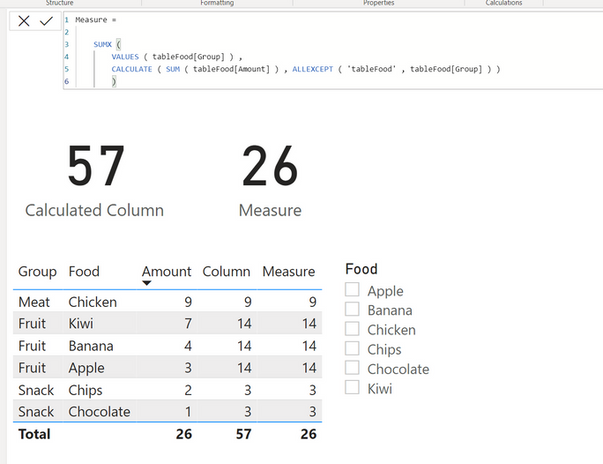
Although @Kevin_Harper has provided a very good output in terms of Calculated Columns, there is a challenge with using this for the output as evident below. The total of the Calculated Column totals the amounts at the row level and therefore can overstate the actual output.
I recommend using a Measure as per below which provides the total amount of 26 when nothing is selected but also achieves the group subtotal in the Card visual itself.
The Measure is as follows:
Measure =

    SUMX (
        VALUES ( tableFood[Group] ) ,
        CALCULATE ( SUM ( tableFood[Amount] ) , ALLEXCEPT ( 'tableFood' , tableFood[Group] ) )
        )
All the best.
If I have posted a response that resolves your question, please accept it as a solution to formally close the post.
Also, if you are as passionate about Power BI, DAX and data as I am, please feel free to reach out if you have any questions, queries, or if you simply want to connect and talk to another data geek!
Want to connect?www.linkedin.com/in/theoconias
- Mark as New
- Bookmark
- Subscribe
- Mute
- Subscribe to RSS Feed
- Permalink
- Report Inappropriate Content
I believe I just answered this question myself - you would add a the date column to the ALLEXCEPT statement. Thank you so much to everyone. Brilliant support!
- Mark as New
- Bookmark
- Subscribe
- Mute
- Subscribe to RSS Feed
- Permalink
- Report Inappropriate Content
This support has been amazing, thank you to everyone.
@TheoC If I wanted to add a date aspect to this with a date slicer and dates next to the food, how would that alter the measure you provided?
- Mark as New
- Bookmark
- Subscribe
- Mute
- Subscribe to RSS Feed
- Permalink
- Report Inappropriate Content
@kamil947 I definitely recommend using a Date table. They can be easily generated using DAX and the "New Table" button on the Model ribbon.
Here is a link to a simple DAX table: https://www.sqlbi.com/articles/creating-a-simple-date-table-in-dax/
From there, you will need to add additional a column of data into your fact table to enable relevance to occure between you Date table and Fact table.
Otherwise, you can just add the Date data to you existing table: it just wouldn't really be "best practice" and you may find that some standard approaches using DAX and dates together may not work perfectly (I.e. you may require workarounds and all thT).
If I have posted a response that resolves your question, please accept it as a solution to formally close the post.
Also, if you are as passionate about Power BI, DAX and data as I am, please feel free to reach out if you have any questions, queries, or if you simply want to connect and talk to another data geek!
Want to connect?www.linkedin.com/in/theoconias
- Mark as New
- Bookmark
- Subscribe
- Mute
- Subscribe to RSS Feed
- Permalink
- Report Inappropriate Content
@kamil947, apologies. I misread the part that you wanted the "Sum of Group" in the other Card.
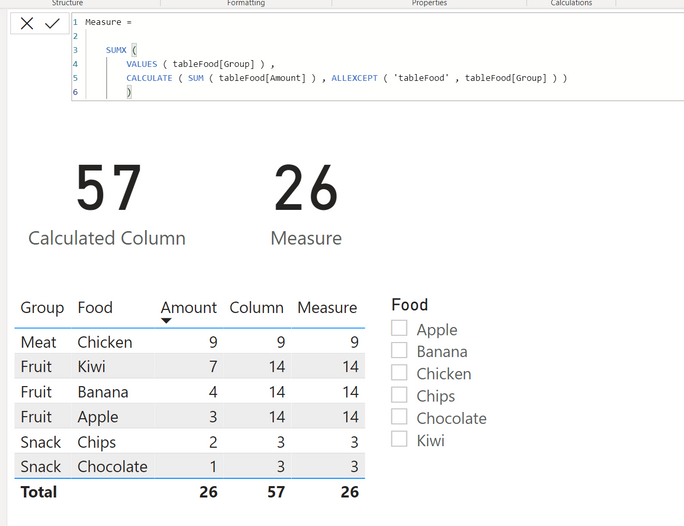
Although @Kevin_Harper has provided a very good output in terms of Calculated Columns, there is a challenge with using this for the output as evident below. The total of the Calculated Column totals the amounts at the row level and therefore can overstate the actual output.
I recommend using a Measure as per below which provides the total amount of 26 when nothing is selected but also achieves the group subtotal in the Card visual itself.
The Measure is as follows:
Measure =

    SUMX (
        VALUES ( tableFood[Group] ) ,
        CALCULATE ( SUM ( tableFood[Amount] ) , ALLEXCEPT ( 'tableFood' , tableFood[Group] ) )
        )
All the best.
If I have posted a response that resolves your question, please accept it as a solution to formally close the post.
Also, if you are as passionate about Power BI, DAX and data as I am, please feel free to reach out if you have any questions, queries, or if you simply want to connect and talk to another data geek!
Want to connect?www.linkedin.com/in/theoconias
- Mark as New
- Bookmark
- Subscribe
- Mute
- Subscribe to RSS Feed
- Permalink
- Report Inappropriate Content
Hi @kamil947 ,
You will need to create an independent slicer table.
slicer = DISTINCT('Table'[Food])Use this table as slicer and then create two measures as below for selected food and group.
food_amount = CALCULATE(SUM('Table'[Amount]),FILTER(ALL('Table'),'Table'[Food]=SELECTEDVALUE('slicer'[Food])))

group_amount =
var _group = CALCULATE(MAX('Table'[Group]),FILTER(ALL('Table'),'Table'[Food]=SELECTEDVALUE(slicer[Food])))
return
CALCULATE(SUM('Table'[Amount]),FILTER(ALL('Table'),'Table'[Group]=_group))
Result would be shown as below.
Best Regards,
Jay
If this post helps, then please consider Accept it as the solution to help the other members find it.
- Mark as New
- Bookmark
- Subscribe
- Mute
- Subscribe to RSS Feed
- Permalink
- Report Inappropriate Content
@kamil947 much easier solution here:
The Measure is as follows:
Measure =

    SUMX (
        VALUES ( tableFood[Group] ) ,
        CALCULATE ( SUM ( tableFood[Amount] ) , ALLEXCEPT ( 'tableFood' , tableFood[Group] ) )
        )
If I have posted a response that resolves your question, please accept it as a solution to formally close the post.
Also, if you are as passionate about Power BI, DAX and data as I am, please feel free to reach out if you have any questions, queries, or if you simply want to connect and talk to another data geek!
Want to connect?www.linkedin.com/in/theoconias
- Mark as New
- Bookmark
- Subscribe
- Mute
- Subscribe to RSS Feed
- Permalink
- Report Inappropriate Content
You can create a column on your table using the ALLEXCEPT function.
Try creating this column on your table:
group subtotals = CALCULATE(SUM('Table'[Amount]), ALLEXCEPT('Table', 'Table'[Group]))
Here is the result:
- Mark as New
- Bookmark
- Subscribe
- Mute
- Subscribe to RSS Feed
- Permalink
- Report Inappropriate Content
This DAX code works theoritically, but it looks like a calculated table can't take dynamic values, so I don't think this is possible in DAX. If there is a workaround for this, I'd like to know!
- Mark as New
- Bookmark
- Subscribe
- Mute
- Subscribe to RSS Feed
- Permalink
- Report Inappropriate Content
Hi @TheoC and thank you.
Is there anyway to just have the 'Food' in the slicer without having to expand within the group and then selecting the food? I ask because I'm looking to build upon this and eventually expand the groupings.
When I select Kiwi using the setting you recommended, I still have both my cards showing the same count when I'd like to show one as the food count for Kiwi (7) and the other the Fruit count (14).
- Mark as New
- Bookmark
- Subscribe
- Mute
- Subscribe to RSS Feed
- Permalink
- Report Inappropriate Content
Hi @kamil947
Just remove the "Group" from the slicer and you can filter using Food names.
Also, in terms of your Card visuals, I am unsure how you're getting those numbers. Did you drag the "Amount" into a Card visual or did you try to create measures? With what you are trying to achieve, you do not need measures. All you need to do is drag the Amount field into a Card visual and ensure you have the Amount field as a "Whole Number" data type.
If I have posted a response that resolves your question, please accept it as a solution to formally close the post.
Also, if you are as passionate about Power BI, DAX and data as I am, please feel free to reach out if you have any questions, queries, or if you simply want to connect and talk to another data geek!
Want to connect?www.linkedin.com/in/theoconias
- Mark as New
- Bookmark
- Subscribe
- Mute
- Subscribe to RSS Feed
- Permalink
- Report Inappropriate Content
@kamil947, apologies. I misread the part that you wanted the "Sum of Group" in the other Card.
Although @Kevin_Harper has provided a very good output in terms of Calculated Columns, there is a challenge with using this for the output as evident below. The total of the Calculated Column totals the amounts at the row level and therefore can overstate the actual output.
I recommend using a Measure as per below which provides the total amount of 26 when nothing is selected but also achieves the group subtotal in the Card visual itself.
The Measure is as follows:
Measure =

    SUMX (
        VALUES ( tableFood[Group] ) ,
        CALCULATE ( SUM ( tableFood[Amount] ) , ALLEXCEPT ( 'tableFood' , tableFood[Group] ) )
        )
All the best.
Theo
If I have posted a response that resolves your question, please accept it as a solution to formally close the post.
Also, if you are as passionate about Power BI, DAX and data as I am, please feel free to reach out if you have any questions, queries, or if you simply want to connect and talk to another data geek!
Want to connect?www.linkedin.com/in/theoconias
- Mark as New
- Bookmark
- Subscribe
- Mute
- Subscribe to RSS Feed
- Permalink
- Report Inappropriate Content
Hi @kamil947
If your table is already structured the way you have presented, then no DAX is needed.
Go to your visuals pane and select the Slicer visual like below and drag the Food and Group field in.
This will allow you to select the Group and the Fruit, returning the Amount you are after 🙂
Hope this helps.
Theo 🙂
If I have posted a response that resolves your question, please accept it as a solution to formally close the post.
Also, if you are as passionate about Power BI, DAX and data as I am, please feel free to reach out if you have any questions, queries, or if you simply want to connect and talk to another data geek!
Want to connect?www.linkedin.com/in/theoconias
Helpful resources

Microsoft Fabric Learn Together
Covering the world! 9:00-10:30 AM Sydney, 4:00-5:30 PM CET (Paris/Berlin), 7:00-8:30 PM Mexico City

Power BI Monthly Update - April 2024
Check out the April 2024 Power BI update to learn about new features.

| User | Count |
|---|---|
| 114 | |
| 100 | |
| 78 | |
| 75 | |
| 49 |
| User | Count |
|---|---|
| 145 | |
| 108 | |
| 107 | |
| 89 | |
| 61 |


