- Power BI forums
- Updates
- News & Announcements
- Get Help with Power BI
- Desktop
- Service
- Report Server
- Power Query
- Mobile Apps
- Developer
- DAX Commands and Tips
- Custom Visuals Development Discussion
- Health and Life Sciences
- Power BI Spanish forums
- Translated Spanish Desktop
- Power Platform Integration - Better Together!
- Power Platform Integrations (Read-only)
- Power Platform and Dynamics 365 Integrations (Read-only)
- Training and Consulting
- Instructor Led Training
- Dashboard in a Day for Women, by Women
- Galleries
- Community Connections & How-To Videos
- COVID-19 Data Stories Gallery
- Themes Gallery
- Data Stories Gallery
- R Script Showcase
- Webinars and Video Gallery
- Quick Measures Gallery
- 2021 MSBizAppsSummit Gallery
- 2020 MSBizAppsSummit Gallery
- 2019 MSBizAppsSummit Gallery
- Events
- Ideas
- Custom Visuals Ideas
- Issues
- Issues
- Events
- Upcoming Events
- Community Blog
- Power BI Community Blog
- Custom Visuals Community Blog
- Community Support
- Community Accounts & Registration
- Using the Community
- Community Feedback
Register now to learn Fabric in free live sessions led by the best Microsoft experts. From Apr 16 to May 9, in English and Spanish.
- Power BI forums
- Forums
- Get Help with Power BI
- Desktop
- Sub-total - Most COUNT value in the group
- Subscribe to RSS Feed
- Mark Topic as New
- Mark Topic as Read
- Float this Topic for Current User
- Bookmark
- Subscribe
- Printer Friendly Page
- Mark as New
- Bookmark
- Subscribe
- Mute
- Subscribe to RSS Feed
- Permalink
- Report Inappropriate Content
Sub-total - Most COUNT value in the group
Hi All,
I am trying hard to find a way to achieve my desired result.
In this group,
Supplier A: occur 4 times
Supplier C: occur 1 time
Supplier E: occur 1 time
I am hoping the Sub-total can show the most frequent supplier, which means "A"
Please refer to the Sample BI
Since "Supplier 1" itself is a measure, I know it will be a little tricky.
Appreciated if I could get any help from here.
For more information, what I am trying to do is to create a table to show the users which suppliers with the lowest cost across all suppliers for each QTY .
Solved! Go to Solution.
- Mark as New
- Bookmark
- Subscribe
- Mute
- Subscribe to RSS Feed
- Permalink
- Report Inappropriate Content
Hi, @ngct1112
1. To create a calculated table:
subT =
var _t1=SUMMARIZE('Table',[Quantity From],"Su",[Supplier 1])
return _t1
2. To create 5 measures
__isP1 = ISFILTERED('Table'[Product Type])__isP2 = ISFILTERED('Table'[Quantity From])P1+P2 = [__isP1]+[__isP2]__maxCountSu =
var _t=MAXX(TOPN(1,SUMMARIZE('subT',[Su],"count",COUNTX('subT',[Su])),[count]),[Su])
return _t__Supplier 1.1 =
SWITCH(
[P1+P2],
1,[__maxCountSu],[Supplier 1])Then the result would be like this:
Please refer to the attachment below for details
Hope this helps.
Best Regards,
Community Support Team _ Zeon Zheng
If this post helps, then please consider Accept it as the solution to help the other members find it more quickly.
- Mark as New
- Bookmark
- Subscribe
- Mute
- Subscribe to RSS Feed
- Permalink
- Report Inappropriate Content
though totally have no idea how it happens, it works fine in the model.
Great thanks for your brillant solution.
- Mark as New
- Bookmark
- Subscribe
- Mute
- Subscribe to RSS Feed
- Permalink
- Report Inappropriate Content
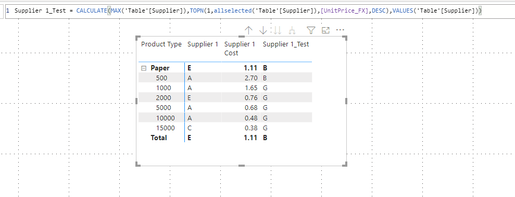
@ngct1112 , Try TOPN, I am assuming it should work at sub total level too
CALCULATE(max(Data[Supplier]),TOPN(1,allselected(Data[Supplier]),[Supplier cost],DESC),VALUES(Data[Supplier]))
Microsoft Power BI Learning Resources, 2023 !!
Learn Power BI - Full Course with Dec-2022, with Window, Index, Offset, 100+ Topics !!
Did I answer your question? Mark my post as a solution! Appreciate your Kudos !! Proud to be a Super User! !!
- Mark as New
- Bookmark
- Subscribe
- Mute
- Subscribe to RSS Feed
- Permalink
- Report Inappropriate Content
Hi @amitchandak , I tried to apply this formual but not working. Attached as Sample BI
Please be reminded that
1. "Unit Price_FX" itself is a meaure.
2. "Supplier 1" is referring to the lowest cost supplier, filtered by a "Rank = 1" measure
Rank by Supplier =
RANKX(
   FILTER(
       ALLSELECTED('Table'[Group],'Table'[Supplier]),
       'Table'[Group]=MAX('Table'[Group])),
       [UnitPrice_FX],,ASC)
Appreciated if there is any solution.
Helpful resources

Microsoft Fabric Learn Together
Covering the world! 9:00-10:30 AM Sydney, 4:00-5:30 PM CET (Paris/Berlin), 7:00-8:30 PM Mexico City

Power BI Monthly Update - April 2024
Check out the April 2024 Power BI update to learn about new features.

| User | Count |
|---|---|
| 109 | |
| 98 | |
| 77 | |
| 66 | |
| 54 |
| User | Count |
|---|---|
| 144 | |
| 104 | |
| 100 | |
| 86 | |
| 64 |


