- Power BI forums
- Updates
- News & Announcements
- Get Help with Power BI
- Desktop
- Service
- Report Server
- Power Query
- Mobile Apps
- Developer
- DAX Commands and Tips
- Custom Visuals Development Discussion
- Health and Life Sciences
- Power BI Spanish forums
- Translated Spanish Desktop
- Power Platform Integration - Better Together!
- Power Platform Integrations (Read-only)
- Power Platform and Dynamics 365 Integrations (Read-only)
- Training and Consulting
- Instructor Led Training
- Dashboard in a Day for Women, by Women
- Galleries
- Community Connections & How-To Videos
- COVID-19 Data Stories Gallery
- Themes Gallery
- Data Stories Gallery
- R Script Showcase
- Webinars and Video Gallery
- Quick Measures Gallery
- 2021 MSBizAppsSummit Gallery
- 2020 MSBizAppsSummit Gallery
- 2019 MSBizAppsSummit Gallery
- Events
- Ideas
- Custom Visuals Ideas
- Issues
- Issues
- Events
- Upcoming Events
- Community Blog
- Power BI Community Blog
- Custom Visuals Community Blog
- Community Support
- Community Accounts & Registration
- Using the Community
- Community Feedback
Register now to learn Fabric in free live sessions led by the best Microsoft experts. From Apr 16 to May 9, in English and Spanish.
- Power BI forums
- Forums
- Get Help with Power BI
- Desktop
- Strange behavior in week over week table
- Subscribe to RSS Feed
- Mark Topic as New
- Mark Topic as Read
- Float this Topic for Current User
- Bookmark
- Subscribe
- Printer Friendly Page
- Mark as New
- Bookmark
- Subscribe
- Mute
- Subscribe to RSS Feed
- Permalink
- Report Inappropriate Content
Strange behavior in week over week table
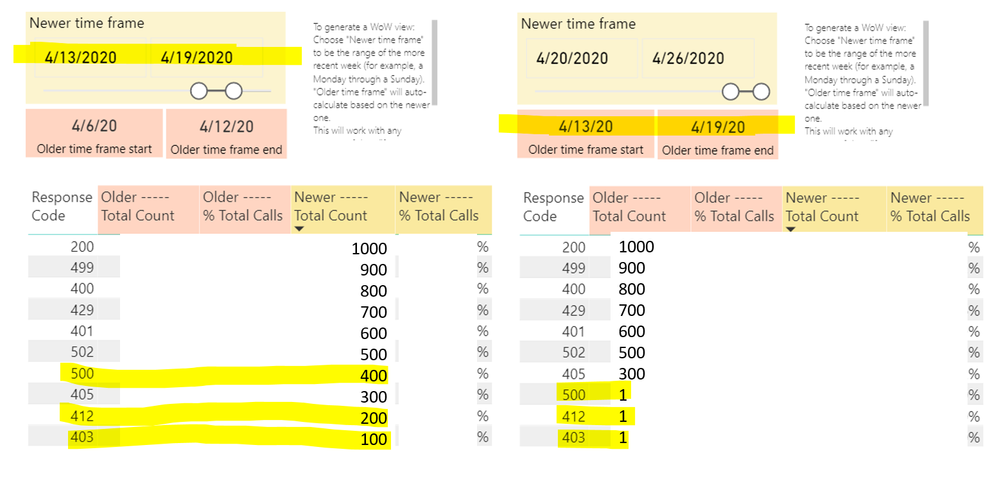
I’m running into an issue that I cannot find a reasonable explanation for. I have a dashboard that calculates the total number of calls our service has by the response code for that call. We are interested in seeing this break down in a week over week view.
In the screenshot below (with data hidden), I show two views of the same dashboard with different times selected. 4/13 – 4/19 is the time frame I'm using in this example. I would expect that the results in the table should be the exact same whether 4/13 – 4/19 is the “newer” time frame or the “older” time frame. This is not the case, but only for a few of the response code rows. For every row except 500, 412, and 403 (the response codes with the lowest counts), when 4/13 – 4/19 is the “older” time frame, many or all of the counts are missing. Every other row, including 200 with the highest counts, has the exact same value whether or not 4/13 – 4/19 is the newer or older time frame. Can anyone help explain why or point me to any good next steps for debugging?
Thanks in advance,
Tessa
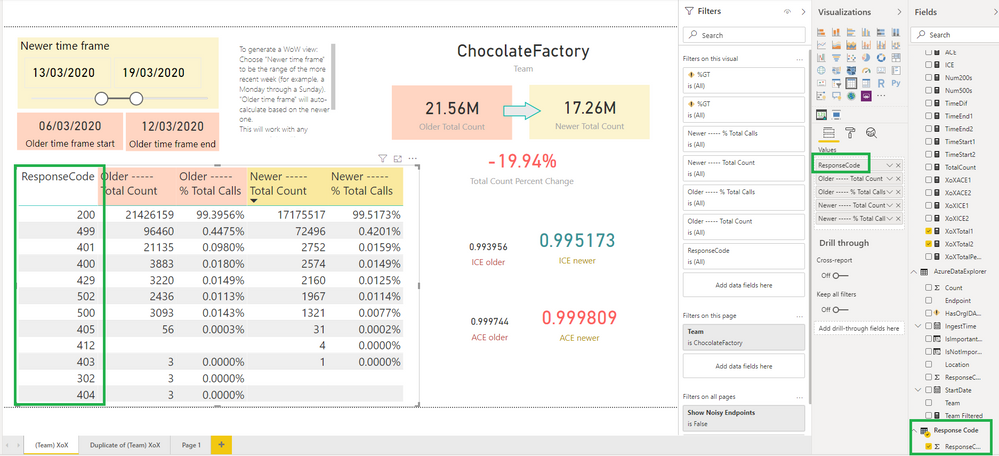
Starting from the top:
Newer time frame slicer
- Selects a time range
- For week over week, we select a week’s worth of time
- Measures are created to capture the slicer values with
TimeStart1 = CALCULATE(MIN(AzureDataExplorer[StartDate]), ALLSELECTED(AzureDataExplorer[StartDate]))
For the start date. The same but with MAX for the end date. A number of days between the two dates is also saved into a measure.
Older time frame start label
TimeStart2 = [TimeStart1] - [TimeDif]
Older time frame end label
TimeEnd2 = [TimeStart1] - 1
Older Total Count column in table
From a new measure
XoXTotal2 =
CALCULATE (
MeasuresGroup[TotalCount],
DATESINPERIOD ( AzureDataExplorer[StartDate], [TimeStart1] - 1, [TimeDif]*-1, DAY )
)
Newer Total Count column in table
From a new measure
XoXTotal1 =
CALCULATE (
MeasuresGroup[TotalCount],
DATESINPERIOD ( AzureDataExplorer[StartDate], [TimeEnd1], [TimeDif]*-1, DAY )
)
Solved! Go to Solution.
- Mark as New
- Bookmark
- Subscribe
- Mute
- Subscribe to RSS Feed
- Permalink
- Report Inappropriate Content
Hi @tessaw ,
The cause is that your date filter will also filter the Response Code. Another separate Response Code table is needed to be created, which won't be filtered by your date filter. Steps are as follows:
1. Create a Response Code table.
Response Code = VALUES(AzureDataExplorer[ResponseCode])
2. Change your [TotalCount] measure like so:
TotalCount =
CALCULATE (
    SUM ( AzureDataExplorer[Count] ),
    FILTER (
        AzureDataExplorer,
        AzureDataExplorer[ResponseCode] IN VALUES ( 'Response Code'[ResponseCode] )
    )
)
3. Replace AzureDataExplorer[ResponseCode] with 'Response Code'[ResponseCode] in your table visuals.
Best Regards,
Icey
If this post helps, then please consider Accept it as the solution to help the other members find it more quickly.
- Mark as New
- Bookmark
- Subscribe
- Mute
- Subscribe to RSS Feed
- Permalink
- Report Inappropriate Content
Hi @tessaw ,
I need a dummy PBIX file for test. Please use virtual data instead of real data and remove sensitive information.
It is suggested to upload the file to OneDrive for Business and then paste the link here.
Best Regards,
Icey
- Mark as New
- Bookmark
- Subscribe
- Mute
- Subscribe to RSS Feed
- Permalink
- Report Inappropriate Content
Hi @Icey - you can find a dummy pbix file here:
https://1drv.ms/u/s!AjUa2LpfGyWTgqdqq1ke0YJB-ViPCQ?e=K1DWpe
Thank you for the help
- Mark as New
- Bookmark
- Subscribe
- Mute
- Subscribe to RSS Feed
- Permalink
- Report Inappropriate Content
Hi @tessaw ,
The cause is that your date filter will also filter the Response Code. Another separate Response Code table is needed to be created, which won't be filtered by your date filter. Steps are as follows:
1. Create a Response Code table.
Response Code = VALUES(AzureDataExplorer[ResponseCode])
2. Change your [TotalCount] measure like so:
TotalCount =
CALCULATE (
    SUM ( AzureDataExplorer[Count] ),
    FILTER (
        AzureDataExplorer,
        AzureDataExplorer[ResponseCode] IN VALUES ( 'Response Code'[ResponseCode] )
    )
)
3. Replace AzureDataExplorer[ResponseCode] with 'Response Code'[ResponseCode] in your table visuals.
Best Regards,
Icey
If this post helps, then please consider Accept it as the solution to help the other members find it more quickly.
- Mark as New
- Bookmark
- Subscribe
- Mute
- Subscribe to RSS Feed
- Permalink
- Report Inappropriate Content
Ahhh!! Thank you! That worked!
I understand that the date filter was also filtering response code but could you explain why were only a few of the counts of response codes affected? Why wouldn't all the values be affected?
- Mark as New
- Bookmark
- Subscribe
- Mute
- Subscribe to RSS Feed
- Permalink
- Report Inappropriate Content
Hi @tessaw ,
This is because there are duplicate response codes in the two date ranges. If you look closely, you will find that the corresponding values in the two date ranges before and after part of the same response codes are different.
Best Regards,
Icey
Helpful resources

Microsoft Fabric Learn Together
Covering the world! 9:00-10:30 AM Sydney, 4:00-5:30 PM CET (Paris/Berlin), 7:00-8:30 PM Mexico City

Power BI Monthly Update - April 2024
Check out the April 2024 Power BI update to learn about new features.

| User | Count |
|---|---|
| 114 | |
| 98 | |
| 86 | |
| 70 | |
| 62 |
| User | Count |
|---|---|
| 151 | |
| 120 | |
| 103 | |
| 87 | |
| 68 |


