cancel
Showing results for 
Search instead for 
Did you mean: 

Register now to learn Fabric in free live sessions led by the best Microsoft experts. From Apr 16 to May 9, in English and Spanish.

Reply
MWilliams
Frequent Visitor

Stop Values from Aggregating

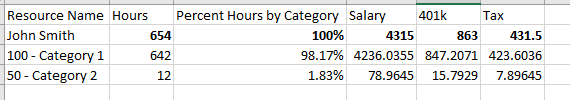
Hi, I am trying to create a matrix in which employee hours are tracked by work category.  There is a value that shows percentage of hours per work category out of employees total hours.  I would then like to multiple the employees salary, 401k, and tax values by this percentage in order to get salary/401k/tax per work category for each employee.  See below image for an example of what I want:  


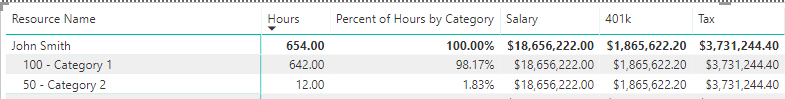
What I keep ending up with is the below screenshot:


I have the salary, 401k, and tax information for each employee in a seperate excel file, see screenshot below (Forgot column headers but the order is: Employee Name, Work Category, Salary, Tax, 401k).  


Does anyone have any advice on how to achieve my desired result?  


Thank you!


Edit:  I should add that I have already played around with the summarization settings.  Don't summarize is not an option.


4 REPLIES 4
v-danhe-msft
Employee
Employee

Hi @MWilliams,

From your data and description, it could work normally on my side:

1.PNG

Could you please share your pbix file to have a test if possible?


Regards,

Daniel He


Community Support Team _ Daniel He
If this post helps, then please consider Accept it as the solution to help the other members find it more quickly.

Thank you so much for trying to help @v-danhe-msft!  My PBIX is in the following link: https://drive.google.com/file/d/17WvTpS29TK6dMo3gdKd-lIhGY4-JW_7K/view?usp=sharing

Hi @MWilliams,

It seemed the format of your [Salary], [Tax] and [401k] showed as text, you need to switch them to number:

1.PNG

Then I could not figure out the relationships you have created in your pbix, I used the 'Business Unit Master' [Column1] to show the subcolumn:

1.PNG

Hope it could help you.


Regards,

Daniel He

Community Support Team _ Daniel He
If this post helps, then please consider Accept it as the solution to help the other members find it more quickly.

@v-danhe-msft Your output has the same problem mine has.  


The 4090 should be split up proportionally to the hours.  I.E. for Category 41 Salary should be roughly 2550 and for Category 45 roughly 1540.  


As for my relationships, all I did was create separate sheets as masters of ResourceName and Categories because they were not unique within any other data sources.  


Edit: to be clear, my problem is two fold.  The first is getting salary, tax, and 401k to show up proportionally per category.  The second is to fix summarization.  4090 is the entirely wrong number, the values are summarizing as first and don't summarize is not an option.  

Helpful resources

Announcements
Microsoft Fabric Learn Together

Microsoft Fabric Learn Together

Covering the world! 9:00-10:30 AM Sydney, 4:00-5:30 PM CET (Paris/Berlin), 7:00-8:30 PM Mexico City

PBI_APRIL_CAROUSEL1

Power BI Monthly Update - April 2024

Check out the April 2024 Power BI update to learn about new features.

April Fabric Community Update

Fabric Community Update - April 2024

Find out what's new and trending in the Fabric Community.