- Power BI forums
- Updates
- News & Announcements
- Get Help with Power BI
- Desktop
- Service
- Report Server
- Power Query
- Mobile Apps
- Developer
- DAX Commands and Tips
- Custom Visuals Development Discussion
- Health and Life Sciences
- Power BI Spanish forums
- Translated Spanish Desktop
- Power Platform Integration - Better Together!
- Power Platform Integrations (Read-only)
- Power Platform and Dynamics 365 Integrations (Read-only)
- Training and Consulting
- Instructor Led Training
- Dashboard in a Day for Women, by Women
- Galleries
- Community Connections & How-To Videos
- COVID-19 Data Stories Gallery
- Themes Gallery
- Data Stories Gallery
- R Script Showcase
- Webinars and Video Gallery
- Quick Measures Gallery
- 2021 MSBizAppsSummit Gallery
- 2020 MSBizAppsSummit Gallery
- 2019 MSBizAppsSummit Gallery
- Events
- Ideas
- Custom Visuals Ideas
- Issues
- Issues
- Events
- Upcoming Events
- Community Blog
- Power BI Community Blog
- Custom Visuals Community Blog
- Community Support
- Community Accounts & Registration
- Using the Community
- Community Feedback
Register now to learn Fabric in free live sessions led by the best Microsoft experts. From Apr 16 to May 9, in English and Spanish.
- Power BI forums
- Forums
- Get Help with Power BI
- Desktop
- Stacked column chart shows different results to ta...
- Subscribe to RSS Feed
- Mark Topic as New
- Mark Topic as Read
- Float this Topic for Current User
- Bookmark
- Subscribe
- Printer Friendly Page
- Mark as New
- Bookmark
- Subscribe
- Mute
- Subscribe to RSS Feed
- Permalink
- Report Inappropriate Content
Stacked column chart shows different results to table
Hi
I’ve being going around in circles with a problem – sample model attached.
https://1drv.ms/u/s!Ap6q8W-mvm27g-cbmJMXeLGVon-74A?e=7sjOzS
I’ve created a measure [#transactions] to find the earliest date of sale for each customer ID and then count where these credentials are matched and it is a new transaction.
I then have a second measure [TotalIDs] that sums these.
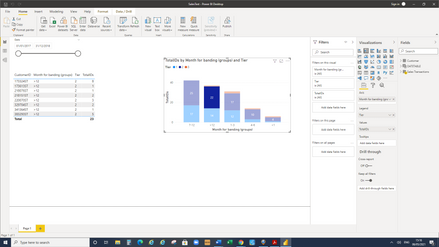
I put these into a stacked column visual against Month for banding and with a legend of Tier. The data looks correct. However, when I click on one of the levels, the table shows different numbers and I just can’t get my head around why?! The numbers are quite close so I’ve screenshot one of the discrepancies.
Can anyone help me understand what I am doing wrong?
Thank you!
- Mark as New
- Bookmark
- Subscribe
- Mute
- Subscribe to RSS Feed
- Permalink
- Report Inappropriate Content
Hi @WBscooby ,
Please try :
TotalIDs = sumx(SUMMARIZE('Sales Transactions','Sales Transactions'[CustomerID],'Sales Transactions'[Month for banding (groups)],'Sales Transactions'[Tier],"Transactions",[#Transactions]),[Transactions])
Best Regards,
Liang
If this post helps, then please consider Accept it as the solution to help the other members find it more quickly.
- Mark as New
- Bookmark
- Subscribe
- Mute
- Subscribe to RSS Feed
- Permalink
- Report Inappropriate Content
Sorry to ask again - I have spent hours trying to work this out for myself but no luck. Is anyone able to assist? Thank you
- Mark as New
- Bookmark
- Subscribe
- Mute
- Subscribe to RSS Feed
- Permalink
- Report Inappropriate Content
Hi
This is really helpful, thank you, but unfortunately it is the wrong way around - I don't think I explained that clearly. The correct number in the chart should be 22 and I am trying to get my table to show the same numbers.
With the measure #Transactions I am trying to find the earliest DateOrigSale for each customer and then count the number of [New Sale] after this.
Helpful resources

Microsoft Fabric Learn Together
Covering the world! 9:00-10:30 AM Sydney, 4:00-5:30 PM CET (Paris/Berlin), 7:00-8:30 PM Mexico City

Power BI Monthly Update - April 2024
Check out the April 2024 Power BI update to learn about new features.

| User | Count |
|---|---|
| 111 | |
| 94 | |
| 80 | |
| 68 | |
| 59 |
| User | Count |
|---|---|
| 150 | |
| 119 | |
| 104 | |
| 87 | |
| 67 |


