- Power BI forums
- Updates
- News & Announcements
- Get Help with Power BI
- Desktop
- Service
- Report Server
- Power Query
- Mobile Apps
- Developer
- DAX Commands and Tips
- Custom Visuals Development Discussion
- Health and Life Sciences
- Power BI Spanish forums
- Translated Spanish Desktop
- Power Platform Integration - Better Together!
- Power Platform Integrations (Read-only)
- Power Platform and Dynamics 365 Integrations (Read-only)
- Training and Consulting
- Instructor Led Training
- Dashboard in a Day for Women, by Women
- Galleries
- Community Connections & How-To Videos
- COVID-19 Data Stories Gallery
- Themes Gallery
- Data Stories Gallery
- R Script Showcase
- Webinars and Video Gallery
- Quick Measures Gallery
- 2021 MSBizAppsSummit Gallery
- 2020 MSBizAppsSummit Gallery
- 2019 MSBizAppsSummit Gallery
- Events
- Ideas
- Custom Visuals Ideas
- Issues
- Issues
- Events
- Upcoming Events
- Community Blog
- Power BI Community Blog
- Custom Visuals Community Blog
- Community Support
- Community Accounts & Registration
- Using the Community
- Community Feedback
Register now to learn Fabric in free live sessions led by the best Microsoft experts. From Apr 16 to May 9, in English and Spanish.
- Power BI forums
- Forums
- Get Help with Power BI
- Desktop
- Re: Stacked Bar Chart - Need to Sort by Percentage
- Subscribe to RSS Feed
- Mark Topic as New
- Mark Topic as Read
- Float this Topic for Current User
- Bookmark
- Subscribe
- Printer Friendly Page
- Mark as New
- Bookmark
- Subscribe
- Mute
- Subscribe to RSS Feed
- Permalink
- Report Inappropriate Content
Stacked Bar Chart - Need to Sort by Percentage
Good morning. I do hope you PBI wizards can help me.
I have four categories of Registered - Yes, Intent, No, and Missing. I have filtered out the Missing as Valid Registered.
What I want is a stacked 100% bar chart that sorts descending by percentage (share) of the Yes. When I use the 100% stacked bar chart, it sorts only by counts, which is not what I want.
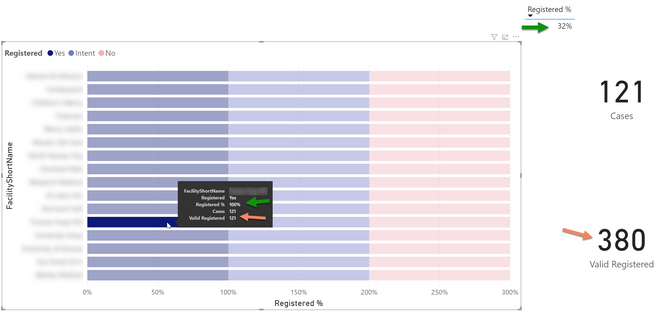
When I use the stacked bar chart, I get the right metrics, but when I use the stacked bar chart, it filters the denominator so every category is treated as 100%. (See the screenshot below - the metrics are showing correctly in the cards, and incorrectly in the stacked bar).
I am relatively new to the PBI community, so I would very much appreciate some guidance as to what to do. I have included a link to a dataset hoping that one of you can assist. I am grateful for this group!
Please see the link to my file: https://1drv.ms/u/s!AiPFJOtfNkzegeZ_TZAVWDM26Z8Q-A?e=NpfFzX
@StackedBar, @StackedBarSorting, @PercentageOfTotal
Solved! Go to Solution.
- Mark as New
- Bookmark
- Subscribe
- Mute
- Subscribe to RSS Feed
- Permalink
- Report Inappropriate Content
Hi @dkernen .
First off, thank you for a post with clear, detailed information and for inclulding your pbix from the start.
I've attached a copy of your report file at the bottom. Look on Duplicate of Page 1 and hopefully that is what you're looking for. Here's what I did:
1) For [Valid Registered] I modified your code to
VR2 =
CALCULATE (
    [Cases],
    FILTER ( ALL ( dimODisp ), dimODisp[Registered] <> "Missing" )
)
2) For [Registered %], I used my VR2 measure
Reg % 2 = DIVIDE([Cases], [VR2])
3) For your sorting issue, I created a new measure [Reg Y]
Reg Y =
DIVIDE (
    CALCULATE ( [Cases], FILTER ( ALL ( dimODisp ), dimODisp[Registered] = "Yes" ) ),
    [VR2]
)
4) Finally, using the Stacked Bar Chart, with [Reg % 2] as "Value", I put [Reg Y] into the Tooltips, which allowed me to sort, in descending order, by the number of "Yes" records.
Hope this helps,
David
- Mark as New
- Bookmark
- Subscribe
- Mute
- Subscribe to RSS Feed
- Permalink
- Report Inappropriate Content
Words cannot express my gratitude. This is EXACTLY what I needed. Thank you so much. I am blessed!
Helpful resources

Microsoft Fabric Learn Together
Covering the world! 9:00-10:30 AM Sydney, 4:00-5:30 PM CET (Paris/Berlin), 7:00-8:30 PM Mexico City

Power BI Monthly Update - April 2024
Check out the April 2024 Power BI update to learn about new features.

| User | Count |
|---|---|
| 109 | |
| 99 | |
| 77 | |
| 66 | |
| 54 |
| User | Count |
|---|---|
| 144 | |
| 104 | |
| 102 | |
| 87 | |
| 64 |


