Hi All, happy holidays! I'm really hoping someone can help solve this problem.
I have a report with several charts and in the shared axis of all those charts, there's "shift date", "week beginning", and "month" values that we use to drill up or down:
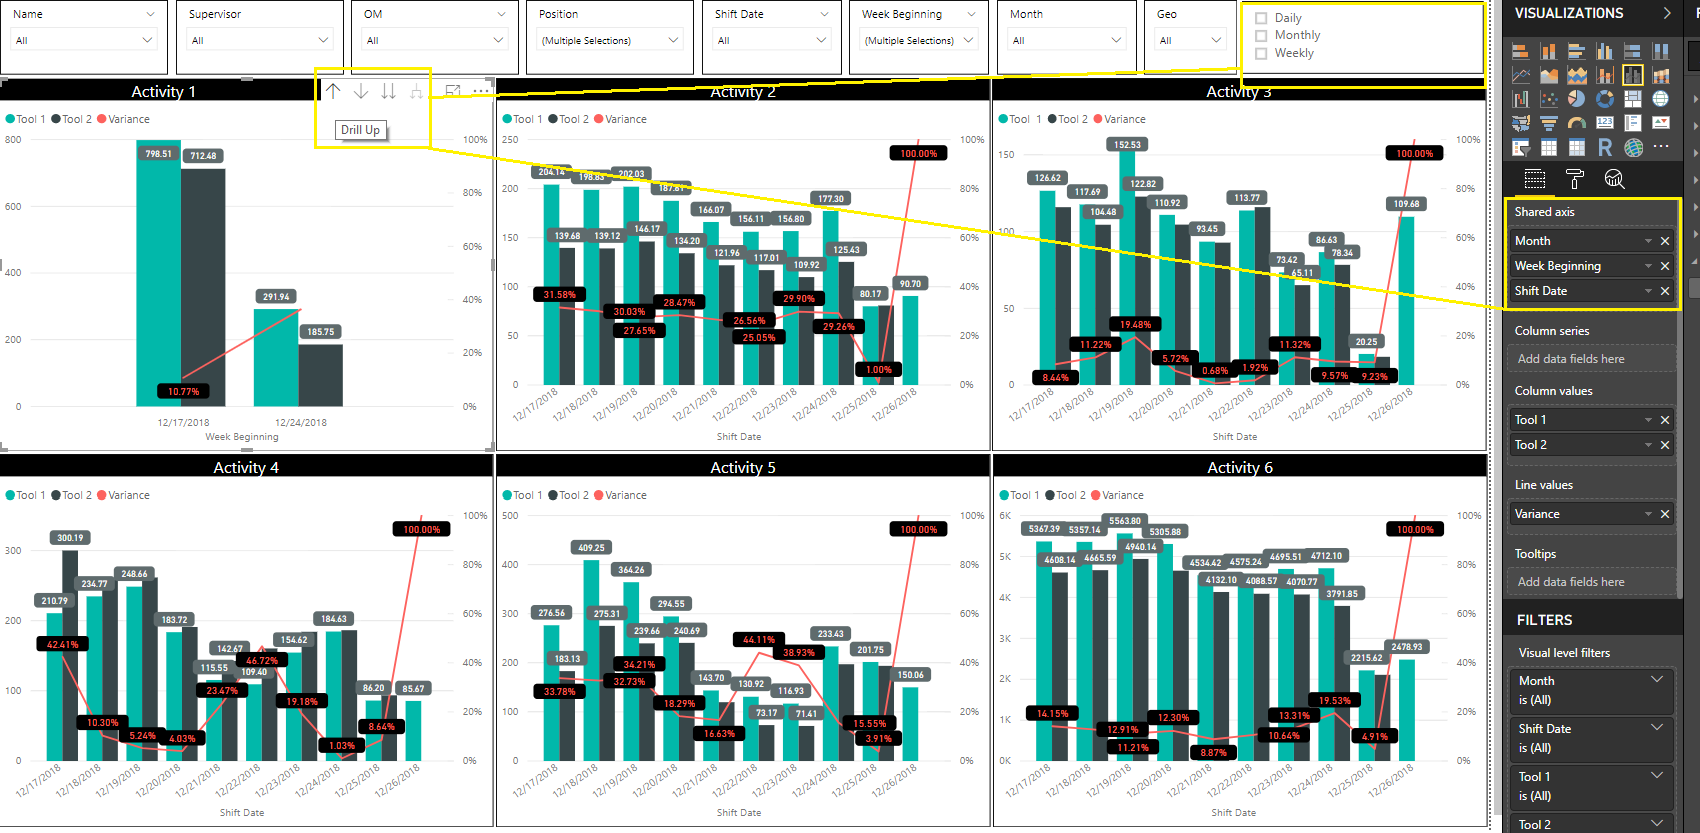
By the way, the charts are comparing the duration or hours spent on two tools per activity.
The users or viewers of the report are having a hard time because by default, all charts are drilled down to "Shift Date" and they have to drill up all charts individually to see the total per week, or per month.
I wanted to have that slicer at the top right showing "Daily", "Weekly", and "Monthly" to drill down or up all the charts at once.
By the way, the raw data looks like this:
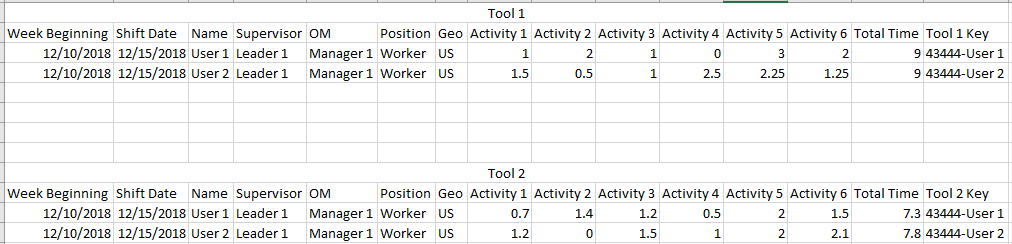
I'm connecting the two tables (Tool 1 and Tool 2) with a key that concatenates the shift date and name columns. The Week Beginning and Shift Date values used in the slicers and axes of the charts are from Tool 1


