- Power BI forums
- Updates
- News & Announcements
- Get Help with Power BI
- Desktop
- Service
- Report Server
- Power Query
- Mobile Apps
- Developer
- DAX Commands and Tips
- Custom Visuals Development Discussion
- Health and Life Sciences
- Power BI Spanish forums
- Translated Spanish Desktop
- Power Platform Integration - Better Together!
- Power Platform Integrations (Read-only)
- Power Platform and Dynamics 365 Integrations (Read-only)
- Training and Consulting
- Instructor Led Training
- Dashboard in a Day for Women, by Women
- Galleries
- Community Connections & How-To Videos
- COVID-19 Data Stories Gallery
- Themes Gallery
- Data Stories Gallery
- R Script Showcase
- Webinars and Video Gallery
- Quick Measures Gallery
- 2021 MSBizAppsSummit Gallery
- 2020 MSBizAppsSummit Gallery
- 2019 MSBizAppsSummit Gallery
- Events
- Ideas
- Custom Visuals Ideas
- Issues
- Issues
- Events
- Upcoming Events
- Community Blog
- Power BI Community Blog
- Custom Visuals Community Blog
- Community Support
- Community Accounts & Registration
- Using the Community
- Community Feedback
Register now to learn Fabric in free live sessions led by the best Microsoft experts. From Apr 16 to May 9, in English and Spanish.
- Power BI forums
- Forums
- Get Help with Power BI
- Desktop
- Re: Show not TOP5 but TOP6-10 results, based on a ...
- Subscribe to RSS Feed
- Mark Topic as New
- Mark Topic as Read
- Float this Topic for Current User
- Bookmark
- Subscribe
- Printer Friendly Page
- Mark as New
- Bookmark
- Subscribe
- Mute
- Subscribe to RSS Feed
- Permalink
- Report Inappropriate Content
Show not TOP5 but TOP6-10 results, based on a calculated value
Hi all,
We have a couple of graphs in which we show the top10, but that shows a lot of data in one graph.
Is there a way to show this in two separate visuals (visual1: 1to5, visual2: 6to10)?
Our graph uses a measure to calculate % positive:

Solved! Go to Solution.
- Mark as New
- Bookmark
- Subscribe
- Mute
- Subscribe to RSS Feed
- Permalink
- Report Inappropriate Content
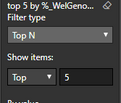
Try using this MEASURE as VISUAL filter.
See file attached as well
RANK =
RANKX ( ALLSELECTED ( 'Sample'[Subject] ), [%_Positive],, DESC, SKIP )
Regards
Zubair
Please try my custom visuals
- Mark as New
- Bookmark
- Subscribe
- Mute
- Subscribe to RSS Feed
- Permalink
- Report Inappropriate Content
Try using this MEASURE as VISUAL filter.
See file attached as well
RANK =
RANKX ( ALLSELECTED ( 'Sample'[Subject] ), [%_Positive],, DESC, SKIP )
Regards
Zubair
Please try my custom visuals
- Mark as New
- Bookmark
- Subscribe
- Mute
- Subscribe to RSS Feed
- Permalink
- Report Inappropriate Content
Thanks for the good and fast answer!
In our 'real' setup, we had another related table that provided the legend items in the graph, so I added a CALCULATE + ALL to combine the ranking of all legend items combined:
RANK = RANKX(ALLSELECTED('Sample'[Subject]);CALCULATE([%_Positive];ALL('Legend items'[Legend item value]));;DESC;Skip)
Works like a charm now 🙂
Helpful resources

Microsoft Fabric Learn Together
Covering the world! 9:00-10:30 AM Sydney, 4:00-5:30 PM CET (Paris/Berlin), 7:00-8:30 PM Mexico City

Power BI Monthly Update - April 2024
Check out the April 2024 Power BI update to learn about new features.

| User | Count |
|---|---|
| 107 | |
| 99 | |
| 76 | |
| 64 | |
| 58 |
| User | Count |
|---|---|
| 148 | |
| 113 | |
| 97 | |
| 84 | |
| 67 |

