- Power BI forums
- Updates
- News & Announcements
- Get Help with Power BI
- Desktop
- Service
- Report Server
- Power Query
- Mobile Apps
- Developer
- DAX Commands and Tips
- Custom Visuals Development Discussion
- Health and Life Sciences
- Power BI Spanish forums
- Translated Spanish Desktop
- Power Platform Integration - Better Together!
- Power Platform Integrations (Read-only)
- Power Platform and Dynamics 365 Integrations (Read-only)
- Training and Consulting
- Instructor Led Training
- Dashboard in a Day for Women, by Women
- Galleries
- Community Connections & How-To Videos
- COVID-19 Data Stories Gallery
- Themes Gallery
- Data Stories Gallery
- R Script Showcase
- Webinars and Video Gallery
- Quick Measures Gallery
- 2021 MSBizAppsSummit Gallery
- 2020 MSBizAppsSummit Gallery
- 2019 MSBizAppsSummit Gallery
- Events
- Ideas
- Custom Visuals Ideas
- Issues
- Issues
- Events
- Upcoming Events
- Community Blog
- Power BI Community Blog
- Custom Visuals Community Blog
- Community Support
- Community Accounts & Registration
- Using the Community
- Community Feedback
Register now to learn Fabric in free live sessions led by the best Microsoft experts. From Apr 16 to May 9, in English and Spanish.
- Power BI forums
- Forums
- Get Help with Power BI
- Desktop
- Re: Selective crossfiltering between visuals
- Subscribe to RSS Feed
- Mark Topic as New
- Mark Topic as Read
- Float this Topic for Current User
- Bookmark
- Subscribe
- Printer Friendly Page
- Mark as New
- Bookmark
- Subscribe
- Mute
- Subscribe to RSS Feed
- Permalink
- Report Inappropriate Content
Selective crossfiltering between visuals
Fellow BI collegues,
I am trying to have a way to limit the interaction between two visuals to limit to one selective dimension. To be precize, I would like to have a the date filtering to be excluded in the cross filtering.
What am I trying to achieve:
I have an Fact_Order list and a Fact_Sales list. Orderdate and saledate are not the same (sales are only considered a sale when they leave our warehouse rather than when the customer places an order). However, I am trying to show when orders are actually accounted as a sale and vice versa (when did orders of today's sale come in?).
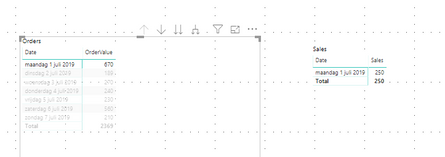
Currently, when you select the orders of a certain date by pressing on this in the "Order" visual, these orders are indeed filtered in the "Sales" table. However, also the date will be filtered. That means I only see orders that have turned into sales on the same day.
I have tried a lot with creating different measures with "USERELATIONSHIP" and also a bridgetable but I do not manage to get the date cross filtering to be removed. I would appreciate your help on this a lot.
Attached I have provided a mockup power bi report where I have both tables provided, also showing the problem I am facing. Seem to be restricted to share mockup power bi reports with you.
Thanks a lot!
Solved! Go to Solution.
- Mark as New
- Bookmark
- Subscribe
- Mute
- Subscribe to RSS Feed
- Permalink
- Report Inappropriate Content
OneDrive has been locked by the administrator of my organization. I have used WeTransfer to share my file. I will also provide screenshots as WeTransfer will remain only temporary: WeTransfer Link for my PBI file
Nevertheless, the conclusion is that it seems to work with my way. However, god knows what trouble I am putting myself in with things I have not foreseen now. For example, time intelligence functions using one universal date dimension rather than two which I have now.
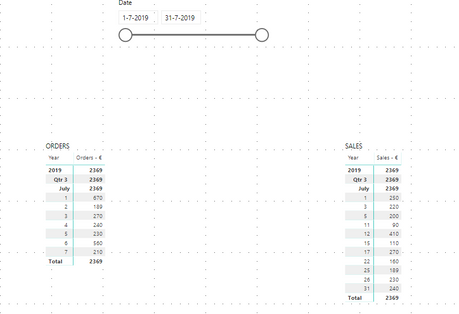
For now, I can crossfilter in both directions: Sales > Orders and Orders > Sales. Also, the date slicer works. The Orders and Sales table in this overview have different date dimension on their axis.
My model using the bridgetable looks like this. The inactive relationships are used for the DAX measure USERELATIONSHIP (see later screenshot how the particular measure looks like).
The bridgetable shows a unique combination of datekey and orderkey.
And here are my two sales and order measures.
Hope this helps and if anyone knows a simplier solution, please share!
Quick update:
If anyone knows a different way of sharing the desktop file. It could help other users and it is a pity Wetransfer only keeps the file for 7 days. Others are also very welcome to reshare my file who have better sharing capabilities.
- Mark as New
- Bookmark
- Subscribe
- Mute
- Subscribe to RSS Feed
- Permalink
- Report Inappropriate Content
Hi @Anonymous ,
If the relations between two tables based on the Date, it will act like yours, but if relations based on another column such as order ID, it should work fine.
If it doesn't meet your requirement, kindly share your sample data and excepted result to me if you don't have any Confidential Information. Please upload your files to One Drive and share the link here.
BTW, pbix as attached.
Community Support Team _ DongLi
If this post helps, then please consider Accept it as the solution to help the other members find it more
If this post helps, then please consider Accept it as the solution to help the other members find it more quickly.
- Mark as New
- Bookmark
- Subscribe
- Mute
- Subscribe to RSS Feed
- Permalink
- Report Inappropriate Content
Thank you for your reply and you effort to even share a PBI example file.
However I am still struggling getting this to work with other dimensions. The both way relationship between the facts cause ambiguity when adding other shared dimensions.
I am working on a bridge (factless) table to allow both side interactivity and with USERELATIONSHIP I am creating seperate measures. Apart I keep two seperate date dimensions so disable the axis to be filtered. Nevertheless, I feel like this is an extremely cumbersome way of achieving this and I also find it hard to foresee what other problems I am running into with this solution.
I find it hard to believe there is no more easier solution, such as Tableau "actions".
Thanks for your reply still!
- Mark as New
- Bookmark
- Subscribe
- Mute
- Subscribe to RSS Feed
- Permalink
- Report Inappropriate Content
Hi @Anonymous,
It should still work fine in a single way relationship (order -> sales), it may be helpful for DAX if you give simple description of two tables such as mockup column names.
You can share your mockup file mentioned before if you don't have any Confidential Information inside by uploading your files to One Drive and share the link here.
Community Support Team _ DongLi
If this post helps, then please consider Accept it as the solution to help the other members find it more
If this post helps, then please consider Accept it as the solution to help the other members find it more quickly.
- Mark as New
- Bookmark
- Subscribe
- Mute
- Subscribe to RSS Feed
- Permalink
- Report Inappropriate Content
OneDrive has been locked by the administrator of my organization. I have used WeTransfer to share my file. I will also provide screenshots as WeTransfer will remain only temporary: WeTransfer Link for my PBI file
Nevertheless, the conclusion is that it seems to work with my way. However, god knows what trouble I am putting myself in with things I have not foreseen now. For example, time intelligence functions using one universal date dimension rather than two which I have now.
For now, I can crossfilter in both directions: Sales > Orders and Orders > Sales. Also, the date slicer works. The Orders and Sales table in this overview have different date dimension on their axis.
My model using the bridgetable looks like this. The inactive relationships are used for the DAX measure USERELATIONSHIP (see later screenshot how the particular measure looks like).
The bridgetable shows a unique combination of datekey and orderkey.
And here are my two sales and order measures.
Hope this helps and if anyone knows a simplier solution, please share!
Quick update:
If anyone knows a different way of sharing the desktop file. It could help other users and it is a pity Wetransfer only keeps the file for 7 days. Others are also very welcome to reshare my file who have better sharing capabilities.
- Mark as New
- Bookmark
- Subscribe
- Mute
- Subscribe to RSS Feed
- Permalink
- Report Inappropriate Content
If you have a measure involved, you could potentially use ALLEXCEPT to remove certain filters.
@ me in replies or I'll lose your thread!!!
Instead of a Kudo, please vote for this idea
Become an expert!: Enterprise DNA
External Tools: MSHGQM
YouTube Channel!: Microsoft Hates Greg
Latest book!: The Definitive Guide to Power Query (M)
DAX is easy, CALCULATE makes DAX hard...
- Mark as New
- Bookmark
- Subscribe
- Mute
- Subscribe to RSS Feed
- Permalink
- Report Inappropriate Content
I have tried the following dax formula:
- Mark as New
- Bookmark
- Subscribe
- Mute
- Subscribe to RSS Feed
- Permalink
- Report Inappropriate Content
@Anonymous I know this is an old thread, but seconded. It's really difficult to achieve the kind of specific filter action options available in Tableau's actions menu.
And this is probably little help now, so far behind, but why not relate sales and orders with a bidirectional relationship on order ID? And then have a common date table with a single-direction filter to both the order and sales tables.
If you used the date field from the actual order and sales tables in your tables, those don't have a relationship to each other, so that should just filter on orderid. If you needed a common date, you could use the date table.
Helpful resources

Microsoft Fabric Learn Together
Covering the world! 9:00-10:30 AM Sydney, 4:00-5:30 PM CET (Paris/Berlin), 7:00-8:30 PM Mexico City

Power BI Monthly Update - April 2024
Check out the April 2024 Power BI update to learn about new features.

| User | Count |
|---|---|
| 114 | |
| 100 | |
| 78 | |
| 75 | |
| 49 |
| User | Count |
|---|---|
| 145 | |
| 108 | |
| 107 | |
| 89 | |
| 61 |


