- Power BI forums
- Updates
- News & Announcements
- Get Help with Power BI
- Desktop
- Service
- Report Server
- Power Query
- Mobile Apps
- Developer
- DAX Commands and Tips
- Custom Visuals Development Discussion
- Health and Life Sciences
- Power BI Spanish forums
- Translated Spanish Desktop
- Power Platform Integration - Better Together!
- Power Platform Integrations (Read-only)
- Power Platform and Dynamics 365 Integrations (Read-only)
- Training and Consulting
- Instructor Led Training
- Dashboard in a Day for Women, by Women
- Galleries
- Community Connections & How-To Videos
- COVID-19 Data Stories Gallery
- Themes Gallery
- Data Stories Gallery
- R Script Showcase
- Webinars and Video Gallery
- Quick Measures Gallery
- 2021 MSBizAppsSummit Gallery
- 2020 MSBizAppsSummit Gallery
- 2019 MSBizAppsSummit Gallery
- Events
- Ideas
- Custom Visuals Ideas
- Issues
- Issues
- Events
- Upcoming Events
- Community Blog
- Power BI Community Blog
- Custom Visuals Community Blog
- Community Support
- Community Accounts & Registration
- Using the Community
- Community Feedback
Register now to learn Fabric in free live sessions led by the best Microsoft experts. From Apr 16 to May 9, in English and Spanish.
- Power BI forums
- Forums
- Get Help with Power BI
- Desktop
- Re: Running total not working as expected in matri...
- Subscribe to RSS Feed
- Mark Topic as New
- Mark Topic as Read
- Float this Topic for Current User
- Bookmark
- Subscribe
- Printer Friendly Page
- Mark as New
- Bookmark
- Subscribe
- Mute
- Subscribe to RSS Feed
- Permalink
- Report Inappropriate Content
Running total not working as expected in matrix
Hi all,
I have a running total measure which seems to work fine when plotted against a date only, however when I try adding it to a matrix with several additional text columns, it no longer works.
The requirement is to create a table or matrix listing a series of transactions with their value and running total. Apart from the date and values I also need to include several descriptive columns (Transaction Type, Account, Tech, Cohort Name). As soon as I add the descriptive columns and try listing each single transaction, the running total stops working.
In the screenshots I’ve shared below:
Value: the value of each single transaction (the actual column is 'Transactions Table'[Cohort])
Cumulative: the running total of Value using this formula:
Cumulative = calculate(sum('Transactions Table'[Cohort]),filter(ALLSELECTED('Calendar'),'Calendar'[Date] <= max('Calendar'[Date])))
Total: the sum of a starting number (63 in this case) and Cumulative. I think this will work if Cumulative works.
The measure Cumulative works fine when plotted only against the Date and Value:
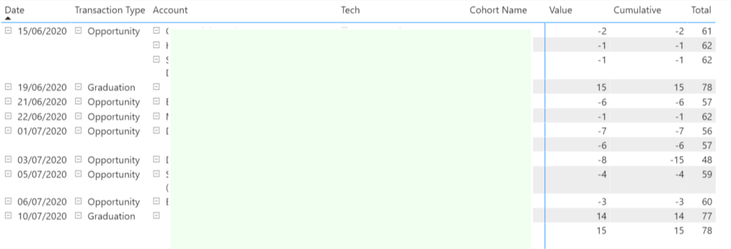
However, the requirement is to list every single transaction with some descriptive details. As soon as I try doing that Cumulative no longer works as a running total but instead becomes equal to Value:
Is there a way to change the DAX for the running total so that it displays correctly when every single item is listed?
Thanks ever so much in advance.
- Mark as New
- Bookmark
- Subscribe
- Mute
- Subscribe to RSS Feed
- Permalink
- Report Inappropriate Content
Try with cumulative total using Earlier in the measure.
Cumulative = calculate(sum('Transactions Table'[Cohort]),filter(all('Transactions Table'),sumx(filter('Transactions Table', earlier('Calendar'[Date])<='Calendar'[Date]),1))
Paul Zheng _ Community Support Team
If this post helps, then please consider Accept it as the solution to help the other members find it more quickly.
- Mark as New
- Bookmark
- Subscribe
- Mute
- Subscribe to RSS Feed
- Permalink
- Report Inappropriate Content
@V-pazhen-msft thanks for your reply. I tried the measure you suggested but it doesn't seem to accept the Date column:
- Mark as New
- Bookmark
- Subscribe
- Mute
- Subscribe to RSS Feed
- Permalink
- Report Inappropriate Content
My bad, should Change the filter table to Calendar table. Give it another try:
Cumulative = calculate(sum('Transactions Table'[Cohort]),filter(all('Calendar'),sumx(filter('Calendar', earlier('Calendar'[Date])<='Calendar'[Date]),1))
Paul Zheng _ Community Support Team
If this post helps, then please consider Accept it as the solution to help the other members find it more quickly.
- Mark as New
- Bookmark
- Subscribe
- Mute
- Subscribe to RSS Feed
- Permalink
- Report Inappropriate Content
Thank you. I'm afraid I'm getting the same issue as with the other measures: it works when plotted only against the date, but as soon as I add another column it stops working 😞
- Mark as New
- Bookmark
- Subscribe
- Mute
- Subscribe to RSS Feed
- Permalink
- Report Inappropriate Content
@vanya_val , Try if this can help
Cumulative =
VAR _min = MINX(Allselected('Calendar'), 'Calendar'[DATE] )
return
calculate(sum('Transactions Table'[Cohort]),filter(ALLSELECTED('Calendar'),'Calendar'[Date] <= max('Calendar'[Date]) && 'Calendar'[Date] >=_min))
Microsoft Power BI Learning Resources, 2023 !!
Learn Power BI - Full Course with Dec-2022, with Window, Index, Offset, 100+ Topics !!
Did I answer your question? Mark my post as a solution! Appreciate your Kudos !! Proud to be a Super User! !!
- Mark as New
- Bookmark
- Subscribe
- Mute
- Subscribe to RSS Feed
- Permalink
- Report Inappropriate Content
Thanks very much @amitchandak . I've added the measure you suggested as CumulativeTest2 but unfortunately I'm getting the same result as before:
Helpful resources

Microsoft Fabric Learn Together
Covering the world! 9:00-10:30 AM Sydney, 4:00-5:30 PM CET (Paris/Berlin), 7:00-8:30 PM Mexico City

Power BI Monthly Update - April 2024
Check out the April 2024 Power BI update to learn about new features.

| User | Count |
|---|---|
| 107 | |
| 100 | |
| 78 | |
| 64 | |
| 58 |
| User | Count |
|---|---|
| 148 | |
| 113 | |
| 97 | |
| 84 | |
| 67 |


