- Power BI forums
- Updates
- News & Announcements
- Get Help with Power BI
- Desktop
- Service
- Report Server
- Power Query
- Mobile Apps
- Developer
- DAX Commands and Tips
- Custom Visuals Development Discussion
- Health and Life Sciences
- Power BI Spanish forums
- Translated Spanish Desktop
- Power Platform Integration - Better Together!
- Power Platform Integrations (Read-only)
- Power Platform and Dynamics 365 Integrations (Read-only)
- Training and Consulting
- Instructor Led Training
- Dashboard in a Day for Women, by Women
- Galleries
- Community Connections & How-To Videos
- COVID-19 Data Stories Gallery
- Themes Gallery
- Data Stories Gallery
- R Script Showcase
- Webinars and Video Gallery
- Quick Measures Gallery
- 2021 MSBizAppsSummit Gallery
- 2020 MSBizAppsSummit Gallery
- 2019 MSBizAppsSummit Gallery
- Events
- Ideas
- Custom Visuals Ideas
- Issues
- Issues
- Events
- Upcoming Events
- Community Blog
- Power BI Community Blog
- Custom Visuals Community Blog
- Community Support
- Community Accounts & Registration
- Using the Community
- Community Feedback
Register now to learn Fabric in free live sessions led by the best Microsoft experts. From Apr 16 to May 9, in English and Spanish.
- Power BI forums
- Forums
- Get Help with Power BI
- Desktop
- Re: Rolling sum based on sorted column
- Subscribe to RSS Feed
- Mark Topic as New
- Mark Topic as Read
- Float this Topic for Current User
- Bookmark
- Subscribe
- Printer Friendly Page
- Mark as New
- Bookmark
- Subscribe
- Mute
- Subscribe to RSS Feed
- Permalink
- Report Inappropriate Content
Rolling sum based on sorted column
I have a requirement to visualize cumulative quantities based on sorted calculated measure "Ticket Qty".
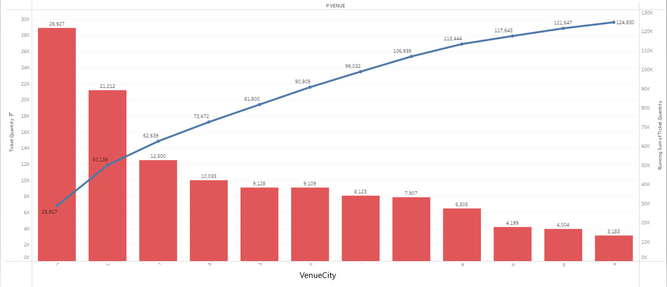
I need to show a chart where on Y-axis, I will have the Ticket Qty and on the X-axis, I will have VenueCity and on Y2-axis, the cumulative total amount calculated based on the sorted "Ticket Qty" column (descending). Please see below.


Thanks a lot.
- Mark as New
- Bookmark
- Subscribe
- Mute
- Subscribe to RSS Feed
- Permalink
- Report Inappropriate Content
Hi, @Anonymous
I tested it. It is best to use the calculation column for rolling summation. If the Ticket Qty is measure, the Ticket Qty cannot be referenced.
If Ticket Qty is a calculated column.
Rank =
RANKX ( 'Table', 'Table'[Ticket Qty], [Ticket Qty], DESC )
Rolling Sum =
CALCULATE (
    SUM ( 'Table'[Ticket Qty] ),
    FILTER ( ALL ( 'Table' ), [Rank] <= EARLIER ( 'Table'[Rank] ) )
)
Rolling Sum Measure =
CALCULATE (
    SUM ( 'Table'[Ticket Qty] ),
    FILTER ( ALL ( 'Table' ), [Rank] <= MAX ( 'Table'[Rank] ) )
)
If my method can't solve your problem. If Ticket Qty can only be measure, can you provide the source data of Ticket Qty and I'll test it again? Thank you.
Best Regards,
Community Support Team _Charlotte
If this post helps, then please consider Accept it as the solution to help the other members find it more quickly.
- Mark as New
- Bookmark
- Subscribe
- Mute
- Subscribe to RSS Feed
- Permalink
- Report Inappropriate Content
Hi @v-zhangti,
You are right Tickets Quantity cannot be referenced if it is a calculated measure and I tried the same logic in a calculated column but it gives me wrong results.
DAX:
Calculate(SUM('Transaction'[Item Count]),FILTER(ALLSELECTED('Item Type'),[Item Type]="Ticket"))
Here is the link to the Ticket Qty sample source data (excel) file.
https://docs.google.com/spreadsheets/d/1eIA2Abarbkl4nXhvtA7gz3hIExB5j13o/edit?usp=sharing&ouid=11317...
Please let me know if you need any more fields data or information.
- Mark as New
- Bookmark
- Subscribe
- Mute
- Subscribe to RSS Feed
- Permalink
- Report Inappropriate Content
Hi, @Anonymous
Thank you for your reply.
You also need to tell me how you got the table below:
| VenueCity | Item Type | Tickets Quantity |
| Boston | Ticket | 442393 |
| West Palm Beach | Ticket | 80257 |
| Raleigh | Ticket | 28927 |
| National Harbor | Ticket | 21212 |
| New York | Ticket | 546 |
Because the field "ventuecity" does not appear in the data you provided.
Look forward to your reply.
Best Regards,
Community Support Team _Charlotte
If this post helps, then please consider Accept it as the solution to help the other members find it more quickly.
- Mark as New
- Bookmark
- Subscribe
- Mute
- Subscribe to RSS Feed
- Permalink
- Report Inappropriate Content
Hi @v-zhangti,
Please find the updated excel here with both the Transaction table (has Item Count) and Performance table (has VenueCity) joined on Performance Key (Many to One)
https://docs.google.com/spreadsheets/d/1nDnBezke6IbbfvY_GxcSeDcHhSaLEmN9/edit?usp=sharing&ouid=11317...
Thanks
- Mark as New
- Bookmark
- Subscribe
- Mute
- Subscribe to RSS Feed
- Permalink
- Report Inappropriate Content
Hi, @Anonymous
Thank you for your reply. I have understood the relationship between several fields. I simulated some data to reproduce your problem.
Rolling sum refers directly to the source data during calculation.
Tickets Quantity =
CALCULATE (
    SUM ( 'Transaction'[Item Count] ),
    FILTER (
        ALL( 'Performance' ),
        [VenueCity] = MAX ( Performance[VenueCity] )
    )
)
Rolling Sum =
CALCULATE (
    SUM ( 'Transaction'[Item Count] ),
    FILTER ( ALL ( 'Performance' ), [VenueCity] <= MAX ( Performance[VenueCity] ) )
)
Best Regards,
Community Support Team _Charlotte
If this post helps, then please consider Accept it as the solution to help the other members find it more quickly.
- Mark as New
- Bookmark
- Subscribe
- Mute
- Subscribe to RSS Feed
- Permalink
- Report Inappropriate Content
Hi @v-zhangti
There is a small problem with the rolling sum logic.
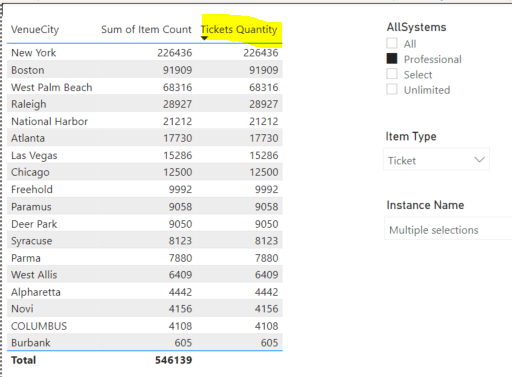
Hers is the screenshot without Rolling Sum which shows correct Ticket Qty for only those VenueCity's which have Item Count for it.
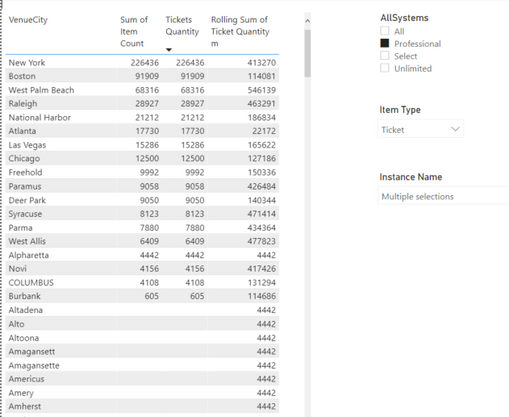
Here is the screenshot with Rolling Sum (sorted descending by Ticket Qty) which does not seem correct.
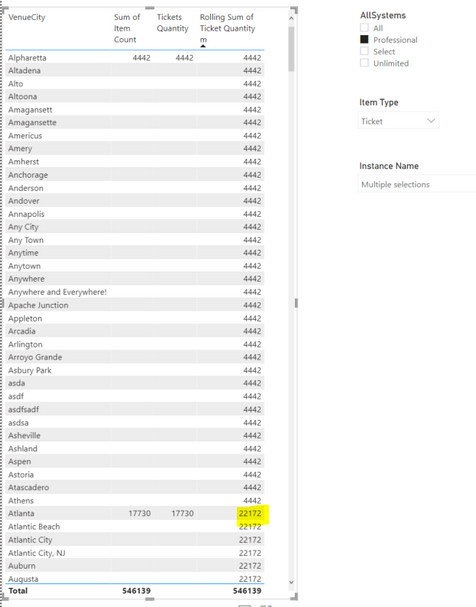
Here is the screenshot again with Rolling Sum, sorted in Ascending Order
Here, I can see Rolling Sum is adding ticket count but in ascending order of VenueCity and it displays all the VenueCity's.
The reason you did not face such an issue is that I had already sent you filtered data. I am again attaching the link with updated data without filters.
https://docs.google.com/spreadsheets/d/1GLQ7TX96b68JoDiDNwZK8We059YaoVrI/edit?usp=sharing&ouid=11317...
Can you please help me resolve it so that Rolling Sum should display values when sorted by Ticket Qty and should display only when there is Item Count and not for all VenueCity's?
- Mark as New
- Bookmark
- Subscribe
- Mute
- Subscribe to RSS Feed
- Permalink
- Report Inappropriate Content
Hi @Anonymous
Try adding a Calculated Column to calculate your sort order
QtyRankCol = RANKX(EventTable,EventTable[Ticket Qty])
RunningTotal =
CALCULATE(
    [TicketQtyMeasure],
    FILTER(
        ALL('EventTable'),
        ISONORAFTER('EventTable'[QtyRankCol], MAX('EventTable'[QtyRankCol]), DESC)
    )
)
If this post helps then please consider Accept it as the solution to help the other members find it more quickly.
- Mark as New
- Bookmark
- Subscribe
- Mute
- Subscribe to RSS Feed
- Permalink
- Report Inappropriate Content
Hi @mattww,
I am not able to get the correct results for QtyRankCol. My data model has the below-shown tables (Transaction table which has Item Count and is connected with Performance table which I earlier mentioned as Event table and this table has VenueCity).
So how I am calculating Ticket Qty is the sum of Item Count for Item Type = Ticket.
I am not sure as to how to get QtyRankCol correctly, can you please help me work on my scenario?
Helpful resources

Microsoft Fabric Learn Together
Covering the world! 9:00-10:30 AM Sydney, 4:00-5:30 PM CET (Paris/Berlin), 7:00-8:30 PM Mexico City

Power BI Monthly Update - April 2024
Check out the April 2024 Power BI update to learn about new features.

| User | Count |
|---|---|
| 110 | |
| 94 | |
| 81 | |
| 66 | |
| 58 |
| User | Count |
|---|---|
| 150 | |
| 119 | |
| 104 | |
| 87 | |
| 67 |


