- Power BI forums
- Updates
- News & Announcements
- Get Help with Power BI
- Desktop
- Service
- Report Server
- Power Query
- Mobile Apps
- Developer
- DAX Commands and Tips
- Custom Visuals Development Discussion
- Health and Life Sciences
- Power BI Spanish forums
- Translated Spanish Desktop
- Power Platform Integration - Better Together!
- Power Platform Integrations (Read-only)
- Power Platform and Dynamics 365 Integrations (Read-only)
- Training and Consulting
- Instructor Led Training
- Dashboard in a Day for Women, by Women
- Galleries
- Community Connections & How-To Videos
- COVID-19 Data Stories Gallery
- Themes Gallery
- Data Stories Gallery
- R Script Showcase
- Webinars and Video Gallery
- Quick Measures Gallery
- 2021 MSBizAppsSummit Gallery
- 2020 MSBizAppsSummit Gallery
- 2019 MSBizAppsSummit Gallery
- Events
- Ideas
- Custom Visuals Ideas
- Issues
- Issues
- Events
- Upcoming Events
- Community Blog
- Power BI Community Blog
- Custom Visuals Community Blog
- Community Support
- Community Accounts & Registration
- Using the Community
- Community Feedback
Register now to learn Fabric in free live sessions led by the best Microsoft experts. From Apr 16 to May 9, in English and Spanish.
- Power BI forums
- Forums
- Get Help with Power BI
- Desktop
- Rolling Sum of Quantity along table (across)
- Subscribe to RSS Feed
- Mark Topic as New
- Mark Topic as Read
- Float this Topic for Current User
- Bookmark
- Subscribe
- Printer Friendly Page
- Mark as New
- Bookmark
- Subscribe
- Mute
- Subscribe to RSS Feed
- Permalink
- Report Inappropriate Content
Rolling Sum of Quantity along table (across)
I have a requirement to visualize cumulative quantities based on sorted calculated measure "Ticket Qty".
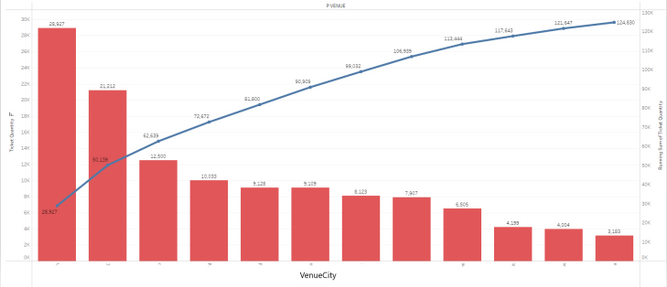
I need to show a chart where on Y-axis, I will have the Ticket Qty and on the X-axis, I will have VenueCity and on Y2-axis (line graph shown below), the cumulative total amount calculated based on the sorted "Ticket Qty" column (descending). Please see below.
But the issue with "Rolling Sum of Ticket Quantity" measure is that when the user filters on Client Name (from Client table) which will obviously fiter VenueCity accordingly, this measure does not calculates rolling sum for only those VenueCity's but for all.
I am not sure how to change the calculation to include ALLSELECTED('Client'[ClientName']).
Also, another issue with this measure is that it calculates Rolling Sum alphabetically for VenueCity's and not Descending Tickets Quantity.
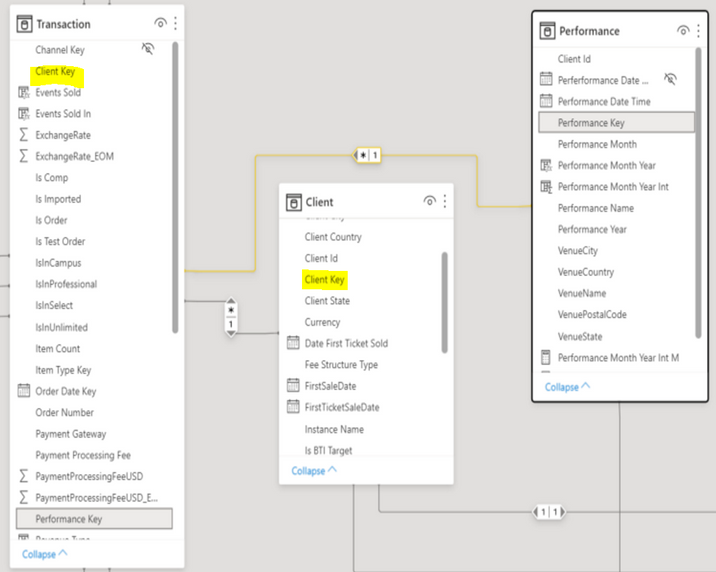
Below shown screenshot is my data model where Transaction table is joined with Client (on Client Key) and Performance table(on Performance Key).

Thanks in Advance!
- Mark as New
- Bookmark
- Subscribe
- Mute
- Subscribe to RSS Feed
- Permalink
- Report Inappropriate Content
Hi @Anonymous ,
Here are the steps you can follow:
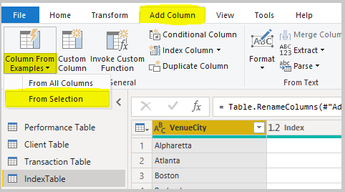
1. Enter the power query, copy the Performance Table and name it IndexTable
2. Delete [Performance Key] in IndexTable, Addcolumn – Column From Examples—From Selction
3. Create Index from custom input data.
4. Create measure.
Tickets Quantity =
SUMX(FILTER( 'Transaction Table','Transaction Table'[Item Type]="Ticket"),[Sum of Item Count])
Roll =
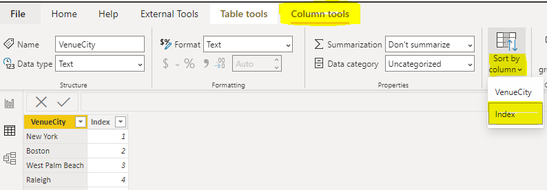
SUMX(FILTER(ALL('Table'),'Table'[Index]<=MAX('IndexTable'[Index])),[Tickets Quantity])5. Select [VenueCity] to create a new table, click Column tools – Sort by column – [index]
6. Result:
Best Regards,
Liu Yang
If this post helps, then please consider Accept it as the solution to help the other members find it more quickly
- Mark as New
- Bookmark
- Subscribe
- Mute
- Subscribe to RSS Feed
- Permalink
- Report Inappropriate Content
Hi @v-yangliu-msft,
Thank you for replying.
I have one question here, are you manually numbering the VenueCity in the Index column (in IndexTable) according to decreasing order of Ticket Qty ? If yes, then it won't work for me because firstly we never know when any city's ticket qty may change and so the ranking or Index value has to be changed.
Secondly, I provided only sample data but in my dataset, I have more than 1000 cities which makes it impossible for me to give each of them an Index value according to their Ticket Qty.
There should be a way where either the Index value set itself according to the decreasing order of Ticket Qty for each VenueCity or we do it in DAX ?
Any thoughts are appreciated?
Thanks again!
- Mark as New
- Bookmark
- Subscribe
- Mute
- Subscribe to RSS Feed
- Permalink
- Report Inappropriate Content
Hi @amitchandak ,
I tried the second option which is filtering Clients and VenueCity. But the Rolling sum of Ticket quantities is giving the same result as Ticket Quantity and not adding the amounts. Also, when there are multiple clients with same VenueCity , it shows only one client's Ticket Qty for Rolling Sum as shown below.
here is the sample data and output for few clients:
https://docs.google.com/spreadsheets/d/1hkXt36x4VmRSJqQ9lP_Q7bmPDujRd1D-/edit?usp=sharing&ouid=11317...
- Mark as New
- Bookmark
- Subscribe
- Mute
- Subscribe to RSS Feed
- Permalink
- Report Inappropriate Content
@Anonymous , First check do you really need all selected in the first measure.
The second one will work best if the city coming from a dimension
Microsoft Power BI Learning Resources, 2023 !!
Learn Power BI - Full Course with Dec-2022, with Window, Index, Offset, 100+ Topics !!
Did I answer your question? Mark my post as a solution! Appreciate your Kudos !! Proud to be a Super User! !!
- Mark as New
- Bookmark
- Subscribe
- Mute
- Subscribe to RSS Feed
- Permalink
- Report Inappropriate Content
Hi @amitchandak ,
Thanks for replying. I did not understand what you mean by "city coming from a dimension ". Did you mean I should create a new Table which has only VenueCity's ? because Performance table is more like a dimension table.
- Mark as New
- Bookmark
- Subscribe
- Mute
- Subscribe to RSS Feed
- Permalink
- Report Inappropriate Content
@Anonymous , sorry misunderstood that try like
CALCULATE( [Tickets Quantity ],
FILTER(
ALLSELECTED('Performance',
ISONORAFTER('Performance'[VenueCity], MAX('Performance'[VenueCity]), DESC)
)
), allselected(client)) // or push allselected of fact
CALCULATE( [Tickets Quantity ],
FILTER(
ALLSELECTED('Performance',
ISONORAFTER('Performance'[VenueCity], MAX('Performance'[VenueCity]), DESC)
)
), filter(allselected(client),client[client Name ] = max(client[Client Name ] )))
If this does not help
Can you share sample data and sample output in table format? Or a sample pbix after removing sensitive data.
Microsoft Power BI Learning Resources, 2023 !!
Learn Power BI - Full Course with Dec-2022, with Window, Index, Offset, 100+ Topics !!
Did I answer your question? Mark my post as a solution! Appreciate your Kudos !! Proud to be a Super User! !!
Helpful resources

Microsoft Fabric Learn Together
Covering the world! 9:00-10:30 AM Sydney, 4:00-5:30 PM CET (Paris/Berlin), 7:00-8:30 PM Mexico City

Power BI Monthly Update - April 2024
Check out the April 2024 Power BI update to learn about new features.

| User | Count |
|---|---|
| 110 | |
| 94 | |
| 81 | |
| 66 | |
| 58 |
| User | Count |
|---|---|
| 150 | |
| 119 | |
| 104 | |
| 87 | |
| 67 |


