cancel
Showing results for 
Search instead for 
Did you mean: 

Register now to learn Fabric in free live sessions led by the best Microsoft experts. From Apr 16 to May 9, in English and Spanish.

Reply
CoreyP
Solution Sage
Solution Sage

Request Help Optimizing Donut Chart

Hello Power BI guru's,


Thanks for your continued sharing of expertise and helping out us little guys to become the proficient business intelligence experts we so desire to be!


PROBLEM: I have a bunch of labor data composed of different "activities" or tasks. I want to display a donut chart that reflects the percentage of that activity's labor to total labor for all activities. On this same report page, I have a labor hours over time bar chart, to see trends in total labor for each activity, SO, I have an activity slicer, so that you can select whichever activity and view the trends. 


WANT: I want the donut chart to change, in addition to the trend bar chart, whenever I change the activity slicer, so that the donut chart shows ONLY the selected activity vs all other labor hours. Here is a picture of what I want vs what I have.


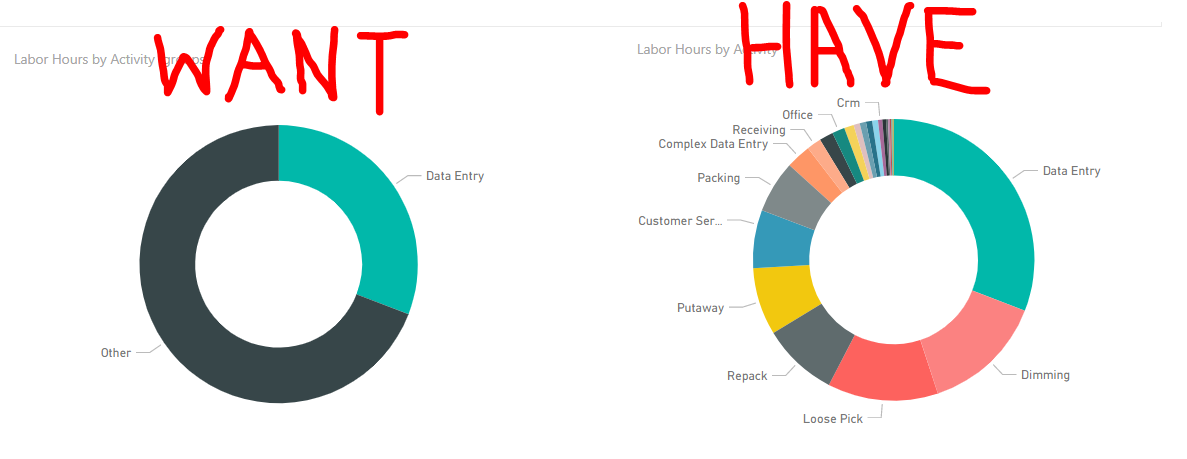
The only way I was able to create the one on the left, was to select the "Data Entry" activity, right click and say "Create Group." Then, it's Data Entry vs all Other. However, I would have to create a seperate column for EVERY activity so each one would be in it's own group, but then the slicer wouldn't work because it's just for activitiy general. 


Can anyone help me out? I'm sure it's something simple. Please don't tell me to just not use a donut chart. lol.

Thanks again!


1 ACCEPTED SOLUTION

I hope this will do it


https://drive.google.com/file/d/1Yt2BYEM8mrM5IqVrC7PAFIN4TI64-Wk5/view?usp=sharing


Subscribe to the @PowerBIHowTo YT channel for an upcoming video on List and Record functions in Power Query!!

Learn Power BI and Fabric - subscribe to our YT channel - Click here: @PowerBIHowTo

If my solution proved useful, I'd be delighted to receive Kudos. When you put effort into asking a question, it's equally thoughtful to acknowledge and give Kudos to the individual who helped you solve the problem. It's a small gesture that shows appreciation and encouragement! ❤


Did I answer your question? Mark my post as a solution. Proud to be a Super User! Appreciate your Kudos 🙂
Feel free to email me with any of your BI needs.

View solution in original post

30 REPLIES 30

Helpful resources

Announcements
Microsoft Fabric Learn Together

Microsoft Fabric Learn Together

Covering the world! 9:00-10:30 AM Sydney, 4:00-5:30 PM CET (Paris/Berlin), 7:00-8:30 PM Mexico City

PBI_APRIL_CAROUSEL1

Power BI Monthly Update - April 2024

Check out the April 2024 Power BI update to learn about new features.

April Fabric Community Update

Fabric Community Update - April 2024

Find out what's new and trending in the Fabric Community.