- Power BI forums
- Updates
- News & Announcements
- Get Help with Power BI
- Desktop
- Service
- Report Server
- Power Query
- Mobile Apps
- Developer
- DAX Commands and Tips
- Custom Visuals Development Discussion
- Health and Life Sciences
- Power BI Spanish forums
- Translated Spanish Desktop
- Power Platform Integration - Better Together!
- Power Platform Integrations (Read-only)
- Power Platform and Dynamics 365 Integrations (Read-only)
- Training and Consulting
- Instructor Led Training
- Dashboard in a Day for Women, by Women
- Galleries
- Community Connections & How-To Videos
- COVID-19 Data Stories Gallery
- Themes Gallery
- Data Stories Gallery
- R Script Showcase
- Webinars and Video Gallery
- Quick Measures Gallery
- 2021 MSBizAppsSummit Gallery
- 2020 MSBizAppsSummit Gallery
- 2019 MSBizAppsSummit Gallery
- Events
- Ideas
- Custom Visuals Ideas
- Issues
- Issues
- Events
- Upcoming Events
- Community Blog
- Power BI Community Blog
- Custom Visuals Community Blog
- Community Support
- Community Accounts & Registration
- Using the Community
- Community Feedback
Register now to learn Fabric in free live sessions led by the best Microsoft experts. From Apr 16 to May 9, in English and Spanish.
- Power BI forums
- Forums
- Get Help with Power BI
- Desktop
- Re: Relationship and Graph Response problem
- Subscribe to RSS Feed
- Mark Topic as New
- Mark Topic as Read
- Float this Topic for Current User
- Bookmark
- Subscribe
- Printer Friendly Page
- Mark as New
- Bookmark
- Subscribe
- Mute
- Subscribe to RSS Feed
- Permalink
- Report Inappropriate Content
Relationship and Graph Response problem
Hi,
I am selecting the data from a ShopName depending on the day selected.
The DAX for the lookupvalue is :
ShopName = LOOKUPVALUE(SHOP[SHOP],SHOP[Production],[Production],SHOP[REGION],RELATED(B01_Trade[REGION]))
And the DAX that controls and outputs the ShopName is:
ShopNames = FILTER(VALUES(B01_Tata[ShopName]),ISBLANK([ShopName])=FALSE())
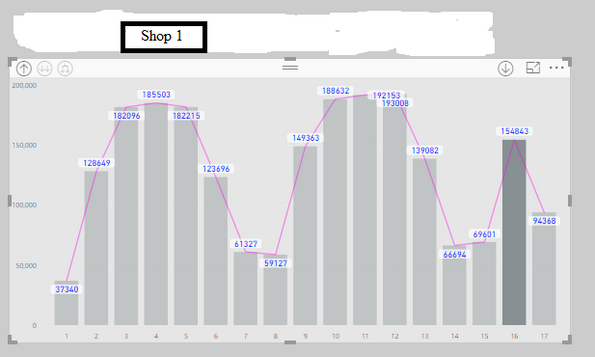
For example, if I select Shop1 on the 16th day as below:
The graphs works fine when showing day interactions (above)
But if I select a day from the above graph, the below data and graph do not respond appropriately. The shopName changes but the data remains the same.
I would like to show the graph and interaction for the 30MinsProduction. But this is not happening.
Please assist
Solved! Go to Solution.
- Mark as New
- Bookmark
- Subscribe
- Mute
- Subscribe to RSS Feed
- Permalink
- Report Inappropriate Content
@Anonymous,
I note that I use wrong DAX to create date column in MeterHHConsumption table, I have edited my previous reply, you should get correct result now.
Also, in MeterHHConsumption table, you can use the DAX below instead to create Date column, and create relationship between the table and Date table using this date column, then you will also get expected result.
Date = MeterHHConsumption[DataTime].[Date]
Regards,
Lydia
If this post helps, then please consider Accept it as the solution to help the other members find it more quickly.
- Mark as New
- Bookmark
- Subscribe
- Mute
- Subscribe to RSS Feed
- Permalink
- Report Inappropriate Content
@Anonymous,
In your scenario, you don't have relationship between A2011_ConfigData table and MeterHHConsumption, thus when you click the day in the first chart, the third chart is not filtered.
You can create a Date column in the MeterHHConsumption using DAX below.
Date = DATE(YEAR(MeterHHConsumption[DataTime]),MONTH(MeterHHConsumption[DataTime]),DAY(MeterHHConsumption[DataTime]))
Then create a new table using DAX below, and create relationship among the three tables(A2011_ConfigData,MeterHHConsumption,DateTable) as shown in the following screenshot.
DateTable =
FILTER(
DISTINCT(
UNION(
DISTINCT(A2011_ConfigData[Date]),
DISTINCT(MeterHHConsumption[Date])
)
),
NOT(ISBLANK(A2011_ConfigData[Date]))
)
This way, the third chart will be filtered correctly.
Regards,
Lydia
If this post helps, then please consider Accept it as the solution to help the other members find it more quickly.
- Mark as New
- Bookmark
- Subscribe
- Mute
- Subscribe to RSS Feed
- Permalink
- Report Inappropriate Content
Hi ,
Great Thanks
Your solution:
But The Chart dispappears whenever I select a particular day??
- Mark as New
- Bookmark
- Subscribe
- Mute
- Subscribe to RSS Feed
- Permalink
- Report Inappropriate Content
@Anonymous,
I note that I use wrong DAX to create date column in MeterHHConsumption table, I have edited my previous reply, you should get correct result now.
Also, in MeterHHConsumption table, you can use the DAX below instead to create Date column, and create relationship between the table and Date table using this date column, then you will also get expected result.
Date = MeterHHConsumption[DataTime].[Date]
Regards,
Lydia
If this post helps, then please consider Accept it as the solution to help the other members find it more quickly.
- Mark as New
- Bookmark
- Subscribe
- Mute
- Subscribe to RSS Feed
- Permalink
- Report Inappropriate Content
@Anonymous,
What is the expected result would you like to show in the second graph when you select day in the first graph? Would you mind sharing me the PBIX file? You can upload the PBIX file to OneDrive and send me the shared link of the file via Private Message.
Regards,
Lydia
If this post helps, then please consider Accept it as the solution to help the other members find it more quickly.
Helpful resources

Microsoft Fabric Learn Together
Covering the world! 9:00-10:30 AM Sydney, 4:00-5:30 PM CET (Paris/Berlin), 7:00-8:30 PM Mexico City

Power BI Monthly Update - April 2024
Check out the April 2024 Power BI update to learn about new features.

| User | Count |
|---|---|
| 114 | |
| 101 | |
| 78 | |
| 75 | |
| 49 |
| User | Count |
|---|---|
| 145 | |
| 108 | |
| 107 | |
| 89 | |
| 61 |


