- Power BI forums
- Updates
- News & Announcements
- Get Help with Power BI
- Desktop
- Service
- Report Server
- Power Query
- Mobile Apps
- Developer
- DAX Commands and Tips
- Custom Visuals Development Discussion
- Health and Life Sciences
- Power BI Spanish forums
- Translated Spanish Desktop
- Power Platform Integration - Better Together!
- Power Platform Integrations (Read-only)
- Power Platform and Dynamics 365 Integrations (Read-only)
- Training and Consulting
- Instructor Led Training
- Dashboard in a Day for Women, by Women
- Galleries
- Community Connections & How-To Videos
- COVID-19 Data Stories Gallery
- Themes Gallery
- Data Stories Gallery
- R Script Showcase
- Webinars and Video Gallery
- Quick Measures Gallery
- 2021 MSBizAppsSummit Gallery
- 2020 MSBizAppsSummit Gallery
- 2019 MSBizAppsSummit Gallery
- Events
- Ideas
- Custom Visuals Ideas
- Issues
- Issues
- Events
- Upcoming Events
- Community Blog
- Power BI Community Blog
- Custom Visuals Community Blog
- Community Support
- Community Accounts & Registration
- Using the Community
- Community Feedback
Register now to learn Fabric in free live sessions led by the best Microsoft experts. From Apr 16 to May 9, in English and Spanish.
- Power BI forums
- Forums
- Get Help with Power BI
- Desktop
- Relational tables
- Subscribe to RSS Feed
- Mark Topic as New
- Mark Topic as Read
- Float this Topic for Current User
- Bookmark
- Subscribe
- Printer Friendly Page
- Mark as New
- Bookmark
- Subscribe
- Mute
- Subscribe to RSS Feed
- Permalink
- Report Inappropriate Content
Relational tables
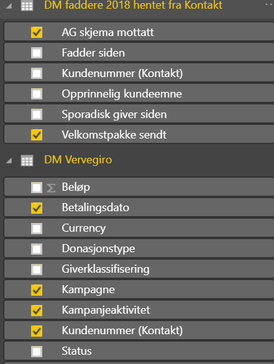
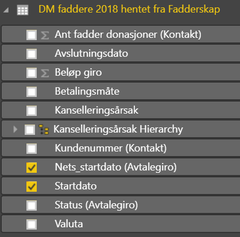
Dashboard below is drawing from sources from DM faddere 2018 hentet fra fadderskap, DM faddere 2018 hentet fra kontakt and DM Vervegiro reports. I need to include payment from the table below (DM faddere 2018 hentet fra donasjoner). In this case I need to include payment from the 8th of January 2018 – velkomstpakke is what I need to filter on and I also need to include the 20th of Feb 2018 which occurs the nets_starts dato from which comes from table DM faddere 2018 hentet fra fadderskap. What I am ultimately trying to do is to see the lapse times between payments by campaign (get an avg) or by customer but need to get the flow right first
Is this possible?
Thanking anyone that can help me in advance 🙂
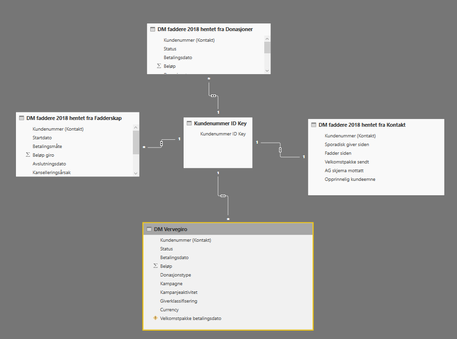
This is how I have the relationships have been managed.
- Mark as New
- Bookmark
- Subscribe
- Mute
- Subscribe to RSS Feed
- Permalink
- Report Inappropriate Content
Hi @Anonymous
Based on my understanding, you need to show columns/values from different fact tables together into a single visual or report.
In this scenario, it is better to create proper data models and aggregation function to use columns from other tables.
Here are some suggestions regrading creating correct data models and relationships
>>Multiple Data Tables in Power Pivot
Please check your relationship setting, for some tables, it is need to select "cross filter direction:both".
https://docs.microsoft.com/en-us/power-bi/desktop-create-and-manage-relationships#cardinality
DAX will calculate the measures/columns against the common dimensions and then let you use the values for the different fact tables in the same analysis
>>https://community.powerbi.com/t5/Desktop/Create-a-Calculated-Column-from-Different-Tables/td-p/60453
Besides, sum, max or any other DAX functions you could consider.
- Mark as New
- Bookmark
- Subscribe
- Mute
- Subscribe to RSS Feed
- Permalink
- Report Inappropriate Content
Hi,
Is there anything else I should add?
Thank you,
Maria
- Mark as New
- Bookmark
- Subscribe
- Mute
- Subscribe to RSS Feed
- Permalink
- Report Inappropriate Content
Hi @Anonymous
It is complex to understand your dataset.
I don't know the language, could you give me an simple example in English.
I make a simple excel with these tables named Table1~Table4
Please enter some data to illustrate your dataset.
"the lapse times between payments by campaign (get an avg) or by customer"
I don't see any words about "lapse times"," payments", "campaign".
| DM faddere 2018 hentet fra fadderskap | table1 |
| DM faddere 2018 hentet fra kontakt | table2 |
| DM Vervegiro | table3 |
| DM faddere 2018 hentet fra donasjoner | table4 |
| link table | |
| please create these tables in the following sheets | |
| just add the columns which needs to be used in your example | |
| don't add too many data, just the data can show your requirement | |
| it is better to show your expect result besides the example data | |
Best regards
Maggie
- Mark as New
- Bookmark
- Subscribe
- Mute
- Subscribe to RSS Feed
- Permalink
- Report Inappropriate Content
Hi,
Should I present this in another way?
Thank you,
Maria
- Mark as New
- Bookmark
- Subscribe
- Mute
- Subscribe to RSS Feed
- Permalink
- Report Inappropriate Content
Hi,
Thank you so much for contacting and wanting to help me. I hope the information i have provided below makes it a little easier. I have excluded some informantin for privacy reasons.
All tables include many different customers numbers.
DM vervegiro - This is first table which is at the beginning of the customer journey from a sent out direct mail. In this table, the campaign and campaign activities are the direct mail activity where memberships were generated. Payment date in this table, alerts us to the fact that this person wants to start their membership. Customer number and other sensitive information has been removed for privacy issues.
DM faddere 2018 hentet fra fadderskap – includes other information relevant to the customer’s membership. Including the person’s start date which should in theory be the same as the DM vervegiro - payment date.
DM faddere 2018 hentet fra kontakt table – Our organisation sends out a welcome pack to the customer to start the customer on a recurring payment plan. Then the customer returns the form, which we can see in the form received date. Then the next column needs to be taken from DM faddere 2018 hentet fra fadderskap. Nets_starts date.

DM faddere 2018 hentet fra donasjoner – mean all payments made from a customer’s subscription from the beginning of their existance. However, from the below table, I am after the payment was made since the nets_start date and any subsequent ones after that date. The problem is the campaign and campaign activities are sometimes the same or different to the ones in the DM vervegiro so I would need a (greater than) net:starts date to filter on to get than.
This is how it should be set up. I'm not to concerned about the time lapses but mainly to get this flow.

- Mark as New
- Bookmark
- Subscribe
- Mute
- Subscribe to RSS Feed
- Permalink
- Report Inappropriate Content
Hi @Anonymous
Thank you for sharing so many details.
For your requirement, i'm not very clear.
Also, it is complex of your data.
I'm stuck on making a test by these.
Based on my knowledge, to "include payment from the 8th of January 2018 to the 20th of Feb 2018",
you could create a measure like
Measure=calculate(sum('table name'[payment]),filter(all('table name'),[date]<=date(2018,2,20)&&[date]>=date(2018,1,8)))
Best Regards
Maggie
- Mark as New
- Bookmark
- Subscribe
- Mute
- Subscribe to RSS Feed
- Permalink
- Report Inappropriate Content
Hi,
Also the time lapse isn't so relevant here in this first instance.
Thank you,
Maria
- Mark as New
- Bookmark
- Subscribe
- Mute
- Subscribe to RSS Feed
- Permalink
- Report Inappropriate Content
Hi Maggie,
Thank you for your input, much appreciated.
To clearify a bit:
I have four different spreadsheets and I want to create a flow with columns taken from each spreadsheet.
To make a simple example:
Let's say each spreadsheet has only 3 columns (A, B and C). I want to create a flow which would look like this:
1A-2B-1C-3A-4C-4B-1B-3B....etc
How do I set this up? The data-set reflects the different columns, but the question is how to create the flow here.
Best Regards,
Maria
Helpful resources

Microsoft Fabric Learn Together
Covering the world! 9:00-10:30 AM Sydney, 4:00-5:30 PM CET (Paris/Berlin), 7:00-8:30 PM Mexico City

Power BI Monthly Update - April 2024
Check out the April 2024 Power BI update to learn about new features.

| User | Count |
|---|---|
| 111 | |
| 95 | |
| 80 | |
| 68 | |
| 59 |
| User | Count |
|---|---|
| 150 | |
| 119 | |
| 104 | |
| 87 | |
| 67 |


