- Power BI forums
- Updates
- News & Announcements
- Get Help with Power BI
- Desktop
- Service
- Report Server
- Power Query
- Mobile Apps
- Developer
- DAX Commands and Tips
- Custom Visuals Development Discussion
- Health and Life Sciences
- Power BI Spanish forums
- Translated Spanish Desktop
- Power Platform Integration - Better Together!
- Power Platform Integrations (Read-only)
- Power Platform and Dynamics 365 Integrations (Read-only)
- Training and Consulting
- Instructor Led Training
- Dashboard in a Day for Women, by Women
- Galleries
- Community Connections & How-To Videos
- COVID-19 Data Stories Gallery
- Themes Gallery
- Data Stories Gallery
- R Script Showcase
- Webinars and Video Gallery
- Quick Measures Gallery
- 2021 MSBizAppsSummit Gallery
- 2020 MSBizAppsSummit Gallery
- 2019 MSBizAppsSummit Gallery
- Events
- Ideas
- Custom Visuals Ideas
- Issues
- Issues
- Events
- Upcoming Events
- Community Blog
- Power BI Community Blog
- Custom Visuals Community Blog
- Community Support
- Community Accounts & Registration
- Using the Community
- Community Feedback
Register now to learn Fabric in free live sessions led by the best Microsoft experts. From Apr 16 to May 9, in English and Spanish.
- Power BI forums
- Forums
- Get Help with Power BI
- Desktop
- Radar Chart comparison - aggregate data
- Subscribe to RSS Feed
- Mark Topic as New
- Mark Topic as Read
- Float this Topic for Current User
- Bookmark
- Subscribe
- Printer Friendly Page
- Mark as New
- Bookmark
- Subscribe
- Mute
- Subscribe to RSS Feed
- Permalink
- Report Inappropriate Content
Radar Chart comparison - aggregate data
I am trying to create a radar chart which allows me to aggregate data and allow me to control the aggregations with slicers. I have the following table with data ready prepared in Power Query with all the unpivoting done. The following table is called Sheet1.
| ID | Continent | Country | City | Year | Attribute | Value |
| 1 | Europe | Germany | Berlin | 2021 | F1 | 50 |
| 1 | Europe | Germany | Berlin | 2021 | F2 | 60 |
| 1 | Europe | Germany | Berlin | 2021 | F3 | 76 |
| 1 | Europe | Germany | Berlin | 2021 | F4 | 80 |
| 1 | Europe | Germany | Berlin | 2021 | F5 | 30 |
| 2 | Africa | Nigeria | Lagos | 2022 | F1 | 23 |
| 2 | Africa | Nigeria | Lagos | 2022 | F2 | 11 |
| 2 | Africa | Nigeria | Lagos | 2022 | F3 | 23 |
| 2 | Africa | Nigeria | Lagos | 2022 | F4 | 23 |
| 2 | Africa | Nigeria | Lagos | 2022 | F5 | 30 |
| 2 | Africa | Nigeria | Lagos | 2022 | F6 | 64 |
| 3 | Asia | Japan | Tokyo | 2021 | F1 | 34 |
| 3 | Asia | Japan | Tokyo | 2021 | F3 | 32 |
| 4 | Asia | Japan | Tokyo | 2021 | F1 | 45 |
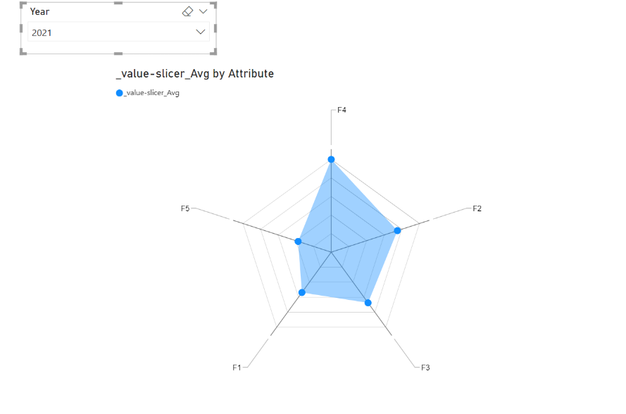
Averaging everything for the year is easy, with an extra table named Year, with one column also named Year and 2 rows, 2021 and 2022. This column goes into a slicer.
| 2021 |
| 2022 |
The category will be Sheet1[Attribute] and the following measure going to the Y Axis:
_value-slicer_Avg = SWITCH(SELECTEDVALUE('Year'[Year]),
                        2021,
                           CALCULATE(AVERAGE(Sheet1[Value]),Sheet1[Year]=2021),
                        2022,
                           CALCULATE(AVERAGE(Sheet1[Value]),Sheet1[Year]=2022)
                    )
This yields the average for a year of choice, when I drop the Year column of the Year table into the slicer

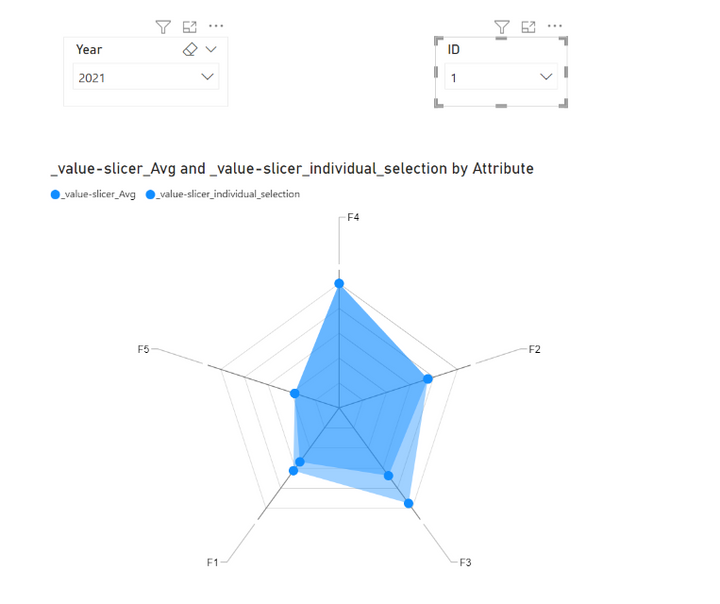
What I want to be able to, is to add another dataset on top of it, which would be easy in case of the data of an ID only (see the Individual Comparison tab of the attached pbix), thanks to the answer posted by Maggie here radar chart filtered comparison
Duplicating the table in PowerQuery (no relations needed) as below...

...I need to create these measures:
_slicer_individual_selection =
        SELECTEDVALUE(Sheet1_New[ID])
_value-slicer_individual_selection =
        CALCULATE(AVERAGE(Sheet1[Value]),FILTER(Sheet1, Sheet1[ID] = [_slicer_individual_selection]))
And drop the ID of the Sheet1_New table in another slicer.

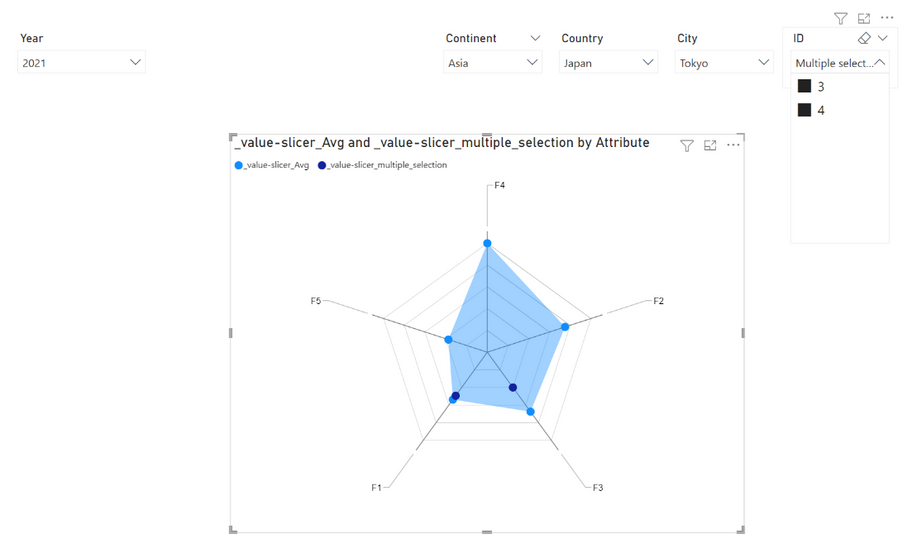
What I want however, is for the second dataset to be the set of the averages of the IDs selected, and the selection should be available at Continent, Country, City or ID level (see the Aggregate Comparison tab of the pbix file attached).
My attempt is not correct, but for the sake of illustration, here it is:
I have replaced the following measure in the Y Axis of the radar chart:
_value-slicer_individual_selection
with this one
_value-slicer_multiple_selection =
        CALCULATE(AVERAGE(Sheet1[Value]),FILTER(Sheet1, Sheet1[ID] IN ALLSELECTED(Sheet1_New[ID])))

It also doesn't let me see all the continents, countries, cities or IDs available, I have to keep selecting things to make them show up. I want to be able to show the aggregate set of any selection of IDs based on the supersets available (continent, country, city) as the second set on top of the original aggregate per year. In the above example, I want to see the average for all the data from Tokyo (please note: for 2021 only) as the second set.
Also, I want the 4 slicers on the right-hand side to update, so that I only get to select the ones for 2021 when the selected Year is 2021 and the same for 2022.
Attachments are not supported, please download them from here: https://drive.google.com/drive/folders/1aHS0kFCIUe407bS59VF_MUhrLygc5wfh
- Mark as New
- Bookmark
- Subscribe
- Mute
- Subscribe to RSS Feed
- Permalink
- Report Inappropriate Content
Hi @kaichapter ,
You want to compare two different datasets (depending on your different slicer selections), right?
According to Maggie's method, you need to create separate tables for the results of your two datasets to provide fields for the slicer.
You wan to be available at Continent, Country, City or ID level, it is recommend that you create calculated tables to extract individual tables.
Best Regards,
Stephen Tao
If this post helps, then please consider Accept it as the solution to help the other members find it more quickly.
Helpful resources

Microsoft Fabric Learn Together
Covering the world! 9:00-10:30 AM Sydney, 4:00-5:30 PM CET (Paris/Berlin), 7:00-8:30 PM Mexico City

Power BI Monthly Update - April 2024
Check out the April 2024 Power BI update to learn about new features.

| User | Count |
|---|---|
| 111 | |
| 94 | |
| 80 | |
| 68 | |
| 59 |
| User | Count |
|---|---|
| 150 | |
| 119 | |
| 104 | |
| 87 | |
| 67 |
