Could you please help me compute a RANK or TOPN function to show my Top 5 Vendors by Total Order Quantity in a line-and-stacked-column chart and it has to response to a slicer?
Here is my data:
1. Big Suppliers Data table:
• Vendor: 39 vendor names (and this column links with the "Vendor" column in the other table described below)
• Big Supplier: only 7 names appear here while the rest are grouped to "Others"
| Vendor | Big Supplier |
| A | A |
| B | Others |
| C | C |
| D | D |
| E | Others |
| F | Others |
| G | G |
| H | H |
| J | J |
| K | Others |
| Y | Others |
| T | T |
| L | Others |
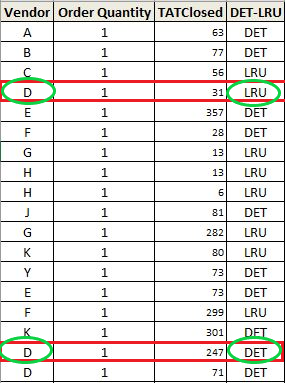
2. Data TAT table (transaction data):
• Vendor
• Order Quantity (1 for every transaction)
• TATClosed
• ReceivedDate
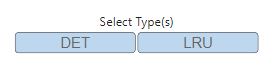
• Business Type (DET or LRU option)
Vendor | Order Quantity | TATClosed | DET-LRU |
A | 1 | 63 | DET |
B | 1 | 77 | DET |
C | 1 | 56 | LRU |
D | 1 | 31 | LRU |
E | 1 | 357 | DET |
F | 1 | 28 | DET |
G | 1 | 13 | DET |
H | 1 | 13 | LRU |
H | 1 | 6 | LRU |
J | 1 | 81 | DET |
G | 1 | 282 | LRU |
K | 1 | 80 | LRU |
Y | 1 | 73 | DET |
E | 1 | 73 | DET |
F | 1 | 299 | LRU |
K | 1 | 301 | DET |
D | 1 | 247 | DET |
D | 1 | 71 | DET |
D | 1 | 190 | LRU |
D | 1 | 163 | LRU |
C | 1 | 55 | DET |
J | 1 | 51 | LRU |
C | 1 | 191 | DET |
C | 1 | 89 | DET |
A | 1 | 130 | LRU |
A | 1 | 176 | DET |
Y | 1 | 305 | DET |
B | 1 | 106 | LRU |
T | 1 | 218 | LRU |
B | 1 | 14 | LRU |
T | 1 | 54 | LRU |
T | 1 | 36 | DET |
L | 1 | 214 | DET |
One vendor can have 2 types of businesses LRU & DET while some might only have 1. As you can see in the 1st picture above, there're only 7 names out of many vendor names appear while the rest are grouped to "Others". That's why If I used "Big Supplier" column as my column series and choose DET or LRU from the slicer, I'd always get all 7 names which is Top 7 and not Top 5 in each business.
How can I use those set-up names to create a Column that can be used to show my Top 5 vendors by Total Order Quantity while making sure it is responsive to a slicer created by "Business Type" column? Because my data already has "Others" and any search results in this forum I was able to find all computed those who are not in TOPN to be "others", which is not what I need or what is applicable to my problem.
Here are my desired result:
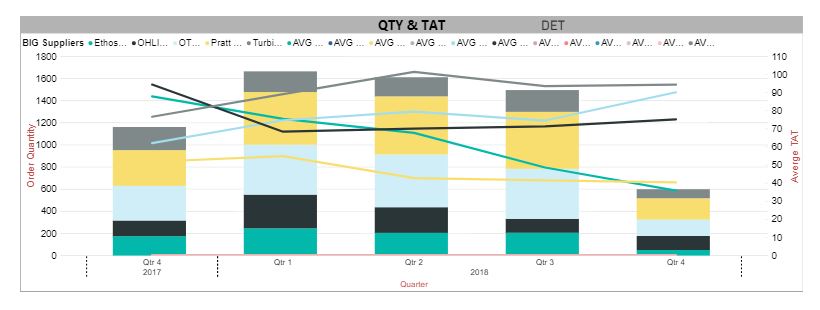
- Both DET & LRU are selected from the slicer, all top suppliers whose names appear in the "Big Supplier" column show up here
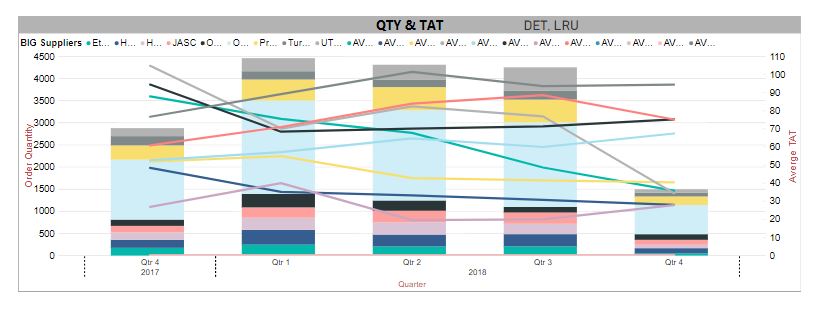
Please let me know if there's a way to do so!
- Only DET is selected: only top 5 Vendors in DET show up along with their corresponding Average Turn-around Time lines.
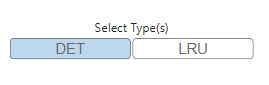
And the same for LRU.
I can't come up with any DAX functions since I have no knowledge or trainings about it. So please if anyone knows how to do this, kindly help me out! Thank you so very much!


