Hey fellow users of PowerBI,
I have a question regarding a measure and something I want to achieve.
I have 3 tables
Table A
Column (Unique): Name
Table B (Main table)
Ton of data
Table C (History table)
Has a message column saying: ColumnXTableB has changed from '' to 'abc'
ColumnBTableB has changed from value 'asd' to 'sad'
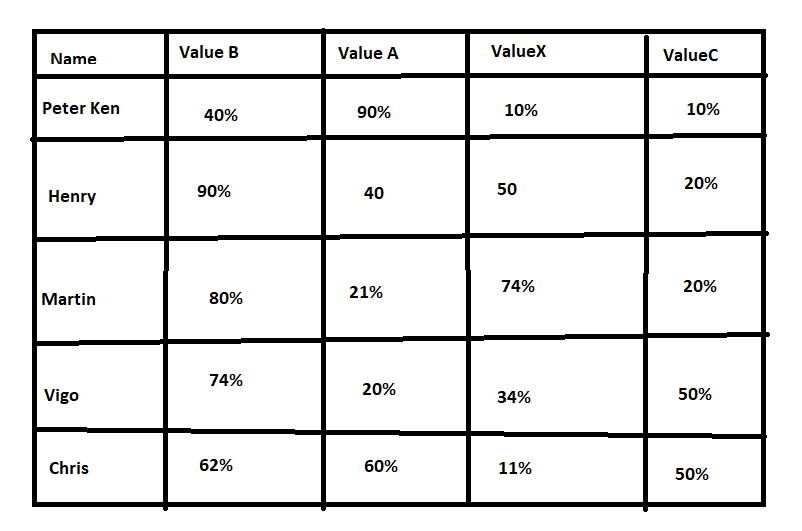
All the 3 tables are linked together, now I want to create a table where first row is using Name from table A which is unique.
Table B has a column with names from Table A for each row. I want to create a table which has most of the rows from Table B which has a percentage in each row / column for each name in table based on how often something has changed in table C to how many rows there are total.
Forexample if we take a look at the below picture and look at "Henry", lets say there is a total of 10 lines having the value (name) Henry in Table B, then I can see in Table C in column "Message" that "ValueBTableA has changed from 'abc' to '123'
So it has changed 1 out of 10 times (10%) so 90% of the time the value was correct and therefor wasnt changed,
one more example could be Henry Value A, here Message in Table C would say "that ValueATableA has changed from '' to '1253' and that would have happened 6 times, (60%) so only 40 of the time the value wasnt changed and therefor correct)
I hope you understand what I want to achieve, but I aint sure how to.
Hopefully some of you guys can help me out:)