- Power BI forums
- Updates
- News & Announcements
- Get Help with Power BI
- Desktop
- Service
- Report Server
- Power Query
- Mobile Apps
- Developer
- DAX Commands and Tips
- Custom Visuals Development Discussion
- Health and Life Sciences
- Power BI Spanish forums
- Translated Spanish Desktop
- Power Platform Integration - Better Together!
- Power Platform Integrations (Read-only)
- Power Platform and Dynamics 365 Integrations (Read-only)
- Training and Consulting
- Instructor Led Training
- Dashboard in a Day for Women, by Women
- Galleries
- Community Connections & How-To Videos
- COVID-19 Data Stories Gallery
- Themes Gallery
- Data Stories Gallery
- R Script Showcase
- Webinars and Video Gallery
- Quick Measures Gallery
- 2021 MSBizAppsSummit Gallery
- 2020 MSBizAppsSummit Gallery
- 2019 MSBizAppsSummit Gallery
- Events
- Ideas
- Custom Visuals Ideas
- Issues
- Issues
- Events
- Upcoming Events
- Community Blog
- Power BI Community Blog
- Custom Visuals Community Blog
- Community Support
- Community Accounts & Registration
- Using the Community
- Community Feedback
Register now to learn Fabric in free live sessions led by the best Microsoft experts. From Apr 16 to May 9, in English and Spanish.
- Power BI forums
- Forums
- Get Help with Power BI
- Desktop
- QoQ alongwith MoM view in one Matrix
- Subscribe to RSS Feed
- Mark Topic as New
- Mark Topic as Read
- Float this Topic for Current User
- Bookmark
- Subscribe
- Printer Friendly Page
- Mark as New
- Bookmark
- Subscribe
- Mute
- Subscribe to RSS Feed
- Permalink
- Report Inappropriate Content
QoQ alongwith MoM view in one Matrix
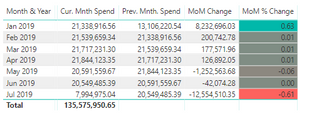
I have spend data which I want to create QoQ and MoM variance analysis, I created below view with QoQ and MoM in separate tables which are working fine
Now I want to have a combine view as shown below, any idea how do I do this? I am trying with Matrix view but its not working well, is it possible? Thanks in advance
- Mark as New
- Bookmark
- Subscribe
- Mute
- Subscribe to RSS Feed
- Permalink
- Report Inappropriate Content
Hi there,
Could you share your calculations? And perhaps some more info on your datamodel?
Robbe
- Mark as New
- Bookmark
- Subscribe
- Mute
- Subscribe to RSS Feed
- Permalink
- Report Inappropriate Content
Hi Robbe,
Here are the calculations
QoQ Analysis
Prev. Qtr. Spend =
Var CurrQtr = SELECTEDVALUE(DATA[Quarter No])
Var CurrYear = SELECTEDVALUE(DATA[Consumption Year])
Var MaxQtrNumber = CALCULATE(MAX(DATA[Quarter No]),ALL(DATA))
Return
SUMX(
FILTER(ALL(DATA),
IF(CurrQtr = 1, DATA[Quarter No] = MaxQtrNumber && DATA[Consumption Year] = CurrYear - 1,
DATA[Quarter No] = CurrQtr - 1 && DATA[Consumption Year] = CurrYear)),
[Amount before Tax USD])
QoQ Change = IF(ISBLANK('DATA'[Prev. Qtr. Spend]),BLANK(),[Total Spend]-[Prev. Qtr. Spend])
QoQ % Change = DIVIDE([QoQ Change],[Prev. Qtr. Spend],0)
MoM Analysis
Prev. Mnth. Spend =
Var CurrMnth = SELECTEDVALUE(DATA[Consumption Month])
Var CurrYear = SELECTEDVALUE(DATA[Consumption Year])
Var MaxMnthNumber = CALCULATE(MAX(DATA[Consumption Month]),ALL(DATA))
Return
SUMX(
FILTER(ALL(DATA),
IF(CurrMnth = 1, DATA[Consumption Month] = MaxMnthNumber && DATA[Consumption Year] = CurrYear - 1,
DATA[Consumption Month] = CurrMnth - 1 && DATA[Consumption Year] = CurrYear)),
[Amount before Tax USD])
MoM Change = IF(ISBLANK('DATA'[Prev. Mnth. Spend]),BLANK(),[Total Spend]-[Prev. Mnth. Spend])
MoM % Change = DIVIDE([MoM Change],[Prev. Mnth. Spend],0)
Data model has Consumption Date, Amount, Expenses Category and few derived columns such as consumption month, consumption quarter, consumption year
Helpful resources

Microsoft Fabric Learn Together
Covering the world! 9:00-10:30 AM Sydney, 4:00-5:30 PM CET (Paris/Berlin), 7:00-8:30 PM Mexico City

Power BI Monthly Update - April 2024
Check out the April 2024 Power BI update to learn about new features.

| User | Count |
|---|---|
| 107 | |
| 100 | |
| 80 | |
| 63 | |
| 58 |
| User | Count |
|---|---|
| 148 | |
| 111 | |
| 94 | |
| 84 | |
| 67 |


