- Power BI forums
- Updates
- News & Announcements
- Get Help with Power BI
- Desktop
- Service
- Report Server
- Power Query
- Mobile Apps
- Developer
- DAX Commands and Tips
- Custom Visuals Development Discussion
- Health and Life Sciences
- Power BI Spanish forums
- Translated Spanish Desktop
- Power Platform Integration - Better Together!
- Power Platform Integrations (Read-only)
- Power Platform and Dynamics 365 Integrations (Read-only)
- Training and Consulting
- Instructor Led Training
- Dashboard in a Day for Women, by Women
- Galleries
- Community Connections & How-To Videos
- COVID-19 Data Stories Gallery
- Themes Gallery
- Data Stories Gallery
- R Script Showcase
- Webinars and Video Gallery
- Quick Measures Gallery
- 2021 MSBizAppsSummit Gallery
- 2020 MSBizAppsSummit Gallery
- 2019 MSBizAppsSummit Gallery
- Events
- Ideas
- Custom Visuals Ideas
- Issues
- Issues
- Events
- Upcoming Events
- Community Blog
- Power BI Community Blog
- Custom Visuals Community Blog
- Community Support
- Community Accounts & Registration
- Using the Community
- Community Feedback
Register now to learn Fabric in free live sessions led by the best Microsoft experts. From Apr 16 to May 9, in English and Spanish.
- Power BI forums
- Forums
- Get Help with Power BI
- Desktop
- Re: Produce daily counts out of period ranges
- Subscribe to RSS Feed
- Mark Topic as New
- Mark Topic as Read
- Float this Topic for Current User
- Bookmark
- Subscribe
- Printer Friendly Page
- Mark as New
- Bookmark
- Subscribe
- Mute
- Subscribe to RSS Feed
- Permalink
- Report Inappropriate Content
Produce daily counts out of period ranges
Hi.
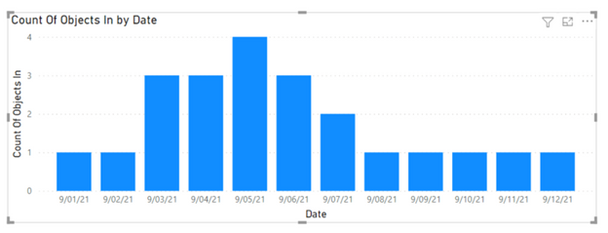
This is about observing and counting objects in a given space (physical or logical, it doesn't matter). Objects will enter a space in a given day and stay there for any number of days. What we want to know is how many objects are in that space at any given day. We want this object count over time, in a period of a month or so.
The end result should be be something such as the chart below.
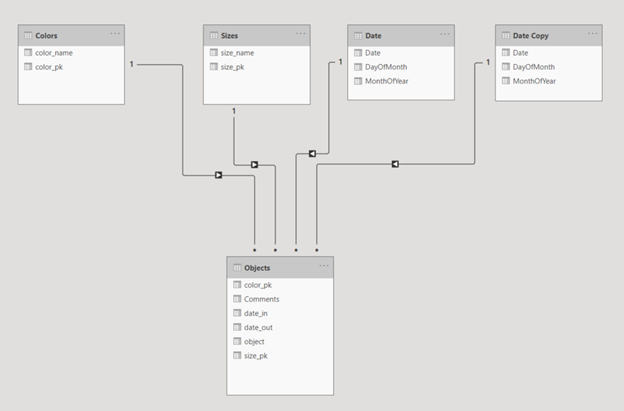
The data model that I will be given is shown below
I can't wrap my mind around what the count measure should be so that the visual above can be produced out of the Objects fact. Looking for any help in this regard.
A few other details:
- there is only one "space" where objects can get in
- the same object will not enter the space more than once
- users should be able to slice-and/dice the visual by the three dimensions shown above: date, color and size.
Thank you very much.
Roque Daudt
Solved! Go to Solution.
- Mark as New
- Bookmark
- Subscribe
- Mute
- Subscribe to RSS Feed
- Permalink
- Report Inappropriate Content
Hey @rdaudt2021 ,
the challenge you are facing has a name: event-in-progress.
This article references all the important articles: https://blog.gbrueckl.at/events-in-progress/
I recommend starting with the article from @SqlJason
If you get stuck, create a pbix file that contains sample data but still reflects your data model. Upload the pbix to onedrive or dropbox and share the link (here in this thread). If you are using Excel to create the sample data, share the xlsx as well.
Hopefully, this helps to tackle your challenge.
Regards,
Tom
Did I answer your question? Mark my post as a solution, this will help others!
Proud to be a Super User!
I accept Kudos 😉
Hamburg, Germany
- Mark as New
- Bookmark
- Subscribe
- Mute
- Subscribe to RSS Feed
- Permalink
- Report Inappropriate Content
That's fantastic, Tom. Exactly what I needed. I may come back to it in regards to a few details but now I know the approach. Thank you very much.
Helpful resources

Microsoft Fabric Learn Together
Covering the world! 9:00-10:30 AM Sydney, 4:00-5:30 PM CET (Paris/Berlin), 7:00-8:30 PM Mexico City

Power BI Monthly Update - April 2024
Check out the April 2024 Power BI update to learn about new features.

| User | Count |
|---|---|
| 110 | |
| 95 | |
| 76 | |
| 65 | |
| 51 |
| User | Count |
|---|---|
| 146 | |
| 109 | |
| 106 | |
| 88 | |
| 61 |


