- Power BI forums
- Updates
- News & Announcements
- Get Help with Power BI
- Desktop
- Service
- Report Server
- Power Query
- Mobile Apps
- Developer
- DAX Commands and Tips
- Custom Visuals Development Discussion
- Health and Life Sciences
- Power BI Spanish forums
- Translated Spanish Desktop
- Power Platform Integration - Better Together!
- Power Platform Integrations (Read-only)
- Power Platform and Dynamics 365 Integrations (Read-only)
- Training and Consulting
- Instructor Led Training
- Dashboard in a Day for Women, by Women
- Galleries
- Community Connections & How-To Videos
- COVID-19 Data Stories Gallery
- Themes Gallery
- Data Stories Gallery
- R Script Showcase
- Webinars and Video Gallery
- Quick Measures Gallery
- 2021 MSBizAppsSummit Gallery
- 2020 MSBizAppsSummit Gallery
- 2019 MSBizAppsSummit Gallery
- Events
- Ideas
- Custom Visuals Ideas
- Issues
- Issues
- Events
- Upcoming Events
- Community Blog
- Power BI Community Blog
- Custom Visuals Community Blog
- Community Support
- Community Accounts & Registration
- Using the Community
- Community Feedback
Register now to learn Fabric in free live sessions led by the best Microsoft experts. From Apr 16 to May 9, in English and Spanish.
- Power BI forums
- Forums
- Get Help with Power BI
- Desktop
- Problem to allign 'Time intelligence' measures wit...
- Subscribe to RSS Feed
- Mark Topic as New
- Mark Topic as Read
- Float this Topic for Current User
- Bookmark
- Subscribe
- Printer Friendly Page
- Mark as New
- Bookmark
- Subscribe
- Mute
- Subscribe to RSS Feed
- Permalink
- Report Inappropriate Content
Problem to allign 'Time intelligence' measures with text fields
Hello,
I am struggling with a problem, which seems very basic but for which I cannot find any solution and would really appreciate your help.
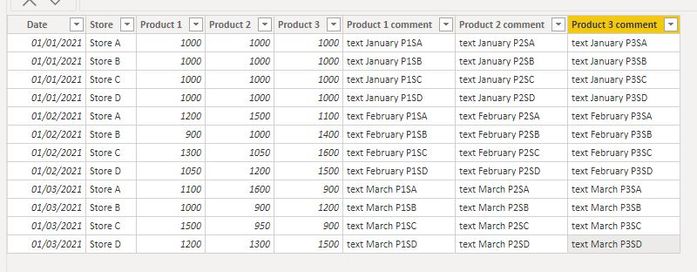
- I have a simple data set of sales of product per store and per dates, as well as text comment for each product sale
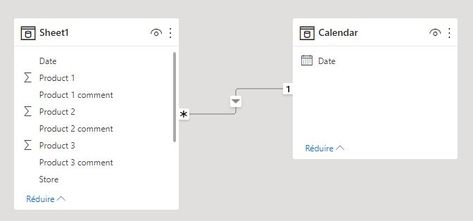
- This set is linked to a calendar table created with CALENDAR() function
CALENDAR(Date(2021,01,01),Date(2021,12,31))- I added one measure to return the previous mont sales and one to return the variation between 2 months
Previousmonth Product1 = CALCULATE(SUM(Sheet1[Product 1]),PREVIOUSMONTH('Calendar'[Date].[Date]))
Previousmonth variation product1 = SUM(Sheet1[Product 1])-[Previousmonth Product1]
The measures are working properly but I am facing problems when I want to display them in a table alligned with the text comment column of the data set. I can display correctly a table with the current sales and variation for each store and another table with the current sales and comments for each store but I am not able to have everything shown properly in a single table (Current and previous month do not allign anymore, variation is not calculated in one row, and comments of previous month are also shown, irrespective of the date filter applied...)
Would you have an idea of what I am doing wrong ?
Thanks in advance for your help.
Solved! Go to Solution.
- Mark as New
- Bookmark
- Subscribe
- Mute
- Subscribe to RSS Feed
- Permalink
- Report Inappropriate Content
Hello,
Thanks for taking the time to answer me. I tried to modify the measures with the one you provided me, however, I'm still facing the same issue.
My basic understanding would be that, since with my measures "call" values from past month, then the text fields of previous month are also displayed.
EDIT :I found a small trick which seems to work : Make a measure from my text.
Text_as_measure = Calculate(MAX(Sheet1[Product 1 comment]))
This way ,measures are shown correctly in one row and then everything is alligned
Is it a correct way to do it, or could I improve it ?
- Mark as New
- Bookmark
- Subscribe
- Mute
- Subscribe to RSS Feed
- Permalink
- Report Inappropriate Content
Hi,
You can try this
1. Create a measure for the total of Product 1, Total_Product_1 = SUM(your_table[Product 1])
2. Create 2nd measure for the previous month Product 1, Previous_month_Total_Product_1=
- Mark as New
- Bookmark
- Subscribe
- Mute
- Subscribe to RSS Feed
- Permalink
- Report Inappropriate Content
Hello,
Thanks for taking the time to answer me. I tried to modify the measures with the one you provided me, however, I'm still facing the same issue.
My basic understanding would be that, since with my measures "call" values from past month, then the text fields of previous month are also displayed.
EDIT :I found a small trick which seems to work : Make a measure from my text.
Text_as_measure = Calculate(MAX(Sheet1[Product 1 comment]))
This way ,measures are shown correctly in one row and then everything is alligned
Is it a correct way to do it, or could I improve it ?
Helpful resources

Microsoft Fabric Learn Together
Covering the world! 9:00-10:30 AM Sydney, 4:00-5:30 PM CET (Paris/Berlin), 7:00-8:30 PM Mexico City

Power BI Monthly Update - April 2024
Check out the April 2024 Power BI update to learn about new features.

| User | Count |
|---|---|
| 110 | |
| 94 | |
| 81 | |
| 66 | |
| 58 |
| User | Count |
|---|---|
| 150 | |
| 119 | |
| 104 | |
| 87 | |
| 67 |


