cancel
Showing results for 
Search instead for 
Did you mean: 

Register now to learn Fabric in free live sessions led by the best Microsoft experts. From Apr 16 to May 9, in English and Spanish.

Reply
Anonymous
Not applicable

Problem conditionally counting rows

Hello,

I am new to Power BI and i'm trying to create a report where i'm counting the amount of rows in a table of state transition records (with a value for an old state and a new state per row) represent certain transitions. I have managed to filter out the transitions by creating a report-wide filter that removes rows with unwanted states (example):

The problem is, there are a few transitions where i need to have my count reduced by one (say, in the example i want the count of 42->5 transitions to be 2, but i want to have the count of 24->5 transitions to be 4). I tried creating a calculated column with the following DAX:

attempt1 =
if( 'merge journals details'[old_status]="24"
    ; //True
        CALCULATE(COUNTROWS('merge journals details')-1)
    ; //False
        CALCULATE(COUNTROWS('merge journals details'))
    )

However, this seems to cause the subtraction to be applied to every iteration of the count, causing the count to become zero for the 24->5 transitions, and some values seem a bit "weird". I attempted to create measures to count the amounts independently of the row context, and that works for displaying the subtracted value in a table, but as soon as i reference the measure in the calculated column, the result is the same. The table shows the "weirdness" i mentioned earlier, i suspect it is subtracting one for each counted element except the filtered ones:

attempt2 =
if( 'merge journals details'[old_status]="24"
    ; //True
        [countMinusOne]
    ; //False
        [wholeCount]
    )


The goal here (as the code seems to imply) would be having the 'attempt2' calculated column have the same values as the 'countMinusOne' column when the 'IF' statement is true, and the same values as the 'wholeCount' column when the statement is false, but instead, all true statements are returning zero, and many false statements are returning different numbers from both columns.

Any ideas?


5 REPLIES 5
v-chuncz-msft
Community Support
Community Support

@Anonymous,


You may take a good look at https://www.sqlbi.com/articles/understanding-context-transition/.

Community Support Team _ Sam Zha
If this post helps, then please consider Accept it as the solution to help the other members find it more quickly.
Anonymous
Not applicable

Hello there, thanks for all the input!

Sorry, i'd rather not share the pbix, the data i'm dealing with isn't my own. Also sorry for the time it took for me to get back, had the project on the back burner for some time now, some important stuff got in the way.

I used @Kristjan76's solution and it mostly worked, but the 'total' row is wrong, and that really pains me because i need to create a pie chart from the data. However it does calculate the correct value per column:

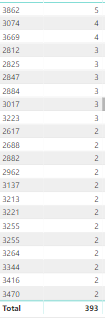
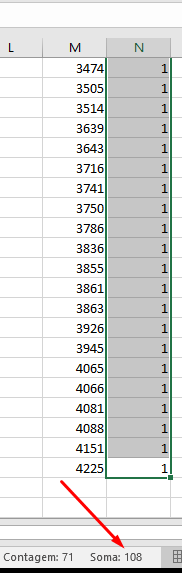
108 should be the correct value here, not 393 (the excel data is exported from the power BI table). First column here is just an ID btw.

I read about row context, filter context and context transitions and i confess i'm a bit lost on the details, but i roughly understand row context as 'the row my operations see', and filter context as 'set of visible data for certain operations'. Supposedly for my problem i need to use the transition to apply a filter context to my count, but calculate (or the measure itself) should be doing that already. I don't understand what i'm supposed to change in my code.

With my limited knowledge of contexts, i didn't really understand what was @ryan_mayu's code supposed to do, particularly the 'earlier' part. Ryan's code however does not give me the correct count, instead giving me much higher numbers, which makes me think it's summing values on the whole column, not on a per-row basis.

The DAX i'm using is currently:

n De Retornos = 
SUMX(
    ADDCOLUMNS(
        SUMMARIZE(
            'transicoes'; //Tabela
            'transicoes'[old_status_name]; //Coluna
            "nrRows"; COUNTROWS('transicoes') //Categorizar por...
        );"nrRows2";
        IF( //Estados que representam retorno:
            'transicoes'[old_status_name]="Aguardando Análise" ||
            'transicoes'[old_status_name]="Aguardando Atendimento" ||
            'transicoes'[old_status_name]="Aguardando Requisitos"
        ; //TRUE
            [nrRows]-1
        ; //FALSE
            [nrRows]
        )
    );
    //RETURN
    if([nrRows2]=0
    ;
    BLANK()
    ;
    [nrRows2]
    )
)

I've since edited a bit how the tables work, so i'm no longer comparing numbers, but strings, those are supposed to represent the 'old_state' on the transition table.

Not sure if i should create a new topic given the change in the nature of the question and the time i've been away, but i'll be posting here anyway, just in case.

ryan_mayu
Super User
Super User

@Anonymous


Is this what you want? Please let me know if I misunderstood your request.  Thanks.


Column = if('Sheet2'[a]=24,CALCULATE(COUNTROWS('Sheet2'),FILTER(Sheet2,EARLIER(Sheet2[a])='Sheet2'[a]))-1,CALCULATE(COUNTROWS('Sheet2'),FILTER(Sheet2,EARLIER(Sheet2[a])='Sheet2'[a])))
 
screenshot.JPG


Did I answer your question? Mark my post as a solution!

Proud to be a Super User!


Kristjan76
Responsive Resident
Responsive Resident

Hi there,


You can do something like this, this would be a measure, not a calculated column.


attempt3 =
SUMX(
  ADDCOLUMNS(
    SUMMARIZE(
      'merge journals details';
      'merge journals details'[old_status];
      "nrRows"; COUNTROWS('merge journals details')
    );
    "nrRows2";IF('merge journals details'[old_status] = "24";[nrRows]-1;[nrRows])
  );
  [nrRows2]
)


Best regards,

Kristjan76

AlB
Super User
Super User

Hi @Anonymous

Can you share the pbix? You'd make it much easier for anyone trying to lend a hand

Helpful resources

Announcements
Microsoft Fabric Learn Together

Microsoft Fabric Learn Together

Covering the world! 9:00-10:30 AM Sydney, 4:00-5:30 PM CET (Paris/Berlin), 7:00-8:30 PM Mexico City

PBI_APRIL_CAROUSEL1

Power BI Monthly Update - April 2024

Check out the April 2024 Power BI update to learn about new features.

April Fabric Community Update

Fabric Community Update - April 2024

Find out what's new and trending in the Fabric Community.