Hi All,
First time post. I've hit a wall and am looking for some creative ways to overcome it.
I have a formula that needs to reference a prior value, iterating upon itself.
I have a calculated column that provides the initial starting value, then I'd like to add another calculated column for additions for that week, then calculate the fallout ((starting value * weekly additions)*(fallout rate)) using another calculated column for fallout rate. The fallout rate will remain constant for all weeks. The fallout should then be removed from the starting value added to the weekly additions. That ending value should be used as the starting value for the next week. I have consolidated all columns into a single table, however the values must be calculated for the same location and the same model.
See below for the excel version of what I'd like calculated. Real figures first and then the calculations below.
| Week | Starting Value | Add (#) | Fallout (%) | Fallout (#) | Ending Total |
| 6 | 127 | 4.47 | 2.48% | 3.260456 | 128.21 |
| 7 | 128.209544 | 3.27 | 2.48% | 3.260692691 | 128.22 |
| 8 | 128.2188513 | 3.27 | 2.48% | 3.260923512 | 128.23 |
| 9 | 128.2279278 | 3.27 | 2.48% | 3.261148609 | 128.24 |
| | | | | | |
| Week | Starting Value | Add (#) | Fallout (%) | Fallout (#) | Ending Total |
| 6 | 127 | 4.47 | 2.40% | =(B8+C8)*(D8) | =(B8+C8)-E8 |
| 7 | =F8 | 3.27 | 2.40% | =(B9+C9)*(D9) | =(B9+C9)-E9 |
| 8 | =F9 | 3.27 | 2.40% | =(B10+C10)*(D10) | =(B10+C10)-E10 |
| 9 | =F10 | 3.27 | 2.40% | =(B11+C11)*(D11) | =(B11+C11)-E11 |
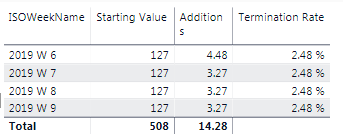
Basic Power BI table below:
I've attempted to do this another way to no avail...
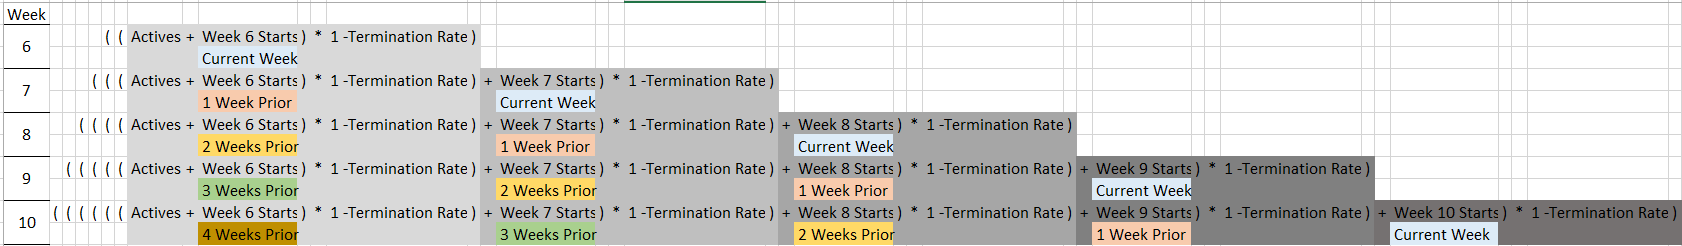
My underlying method was as follows:
However when attempting to create the calculated columns that gathered the starts/additions from the prior weeks, it was summing them or leaving them entirely blank for seemingly no reason.
My thoughts behind it was to create the following calculated columns:
Actives/Starting Value
Current Week Starts/Additions
1 Week Prior Starts/Additions
2 Weeks Prior Starts/Additions
3 Weeks Prior Starts/Additions
4 Weeks Prior Starts/Additions
I created a column in the date table entitled "Include Week" that marks the current week as well as the subsequent five "Include" and all others are blanks.
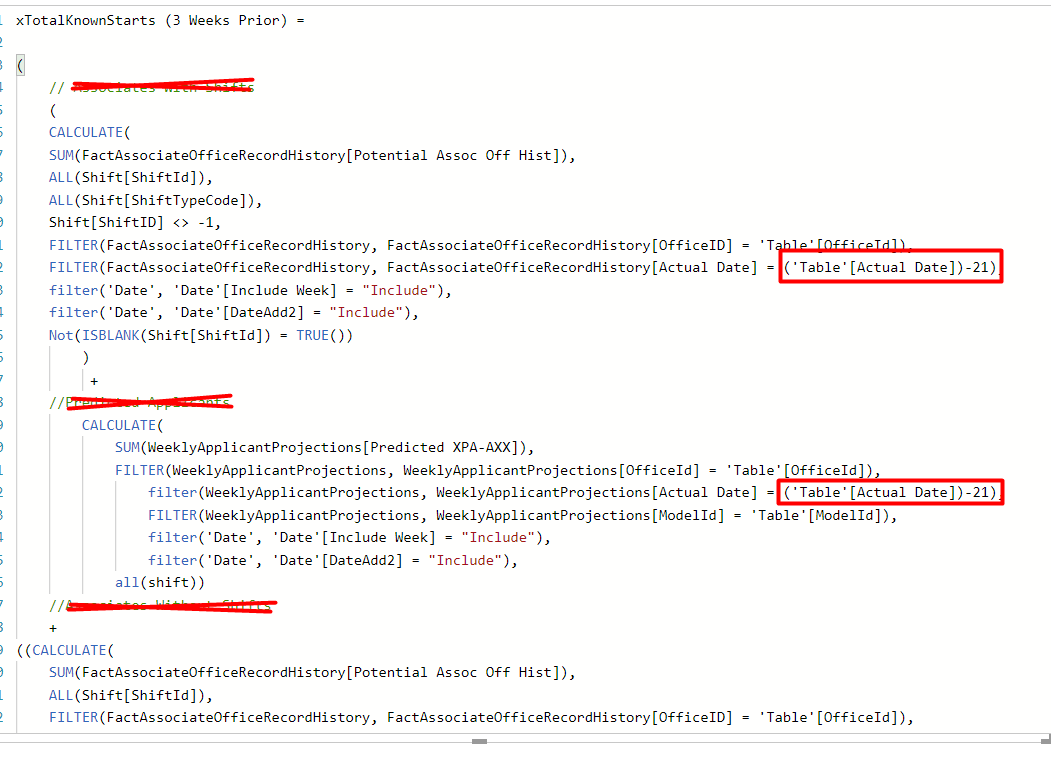
See below for the "3 Weeks Prior" DAX formula I created. Essentially, it is the same formula as for the current week except I'm attempting to pull the data for 21 days prior. The "Actual Date" is always the first date of the week, it's standardized between tables.
My thought was then to create five separate calculated columns, one for summing up each week. I only need five weeks of data at a time, so this would not prove unmanageable at any point.
Week 1 (Current Week):
Actives + Starts = ('Table'[Starting Value] + 'Table'[Additions])*
(1-'Table'[Termination Rate])
Week 2:
Actives + Starts2 = (((('Table'[Starting Value] + 'Table'[xTotalKnownStarts (1 Week Prior)] + 'Table'[xTotalKnownStarts Last Week])
* (1-'Table'[Termination Rate]))
+'Table'[Week 2 TotalKnownStarts]))
*(1-[Termination Rate])
Week 3:
Actives + Starts3 = ((((('Table'[Starting Value] + 'Table'[xTotalKnownStarts (WEEK 1)])
* (1-'Table'[Termination Rate]))
+'Table'[Week 2 TotalKnownStarts]
*(1-[Termination Rate]))
+'Table'[Week 3 TotalKnownStarts])
*(1-'Table'[Termination Rate]))
And so on and so forth. I would then created a calculated column/measure with an if statement to choose which column to utilize dependent on if it is the first, second, third, fourth, or fifth week. I've got that all figured out, the problem exists with creating the calculated columns to sum up the results from prior weeks.
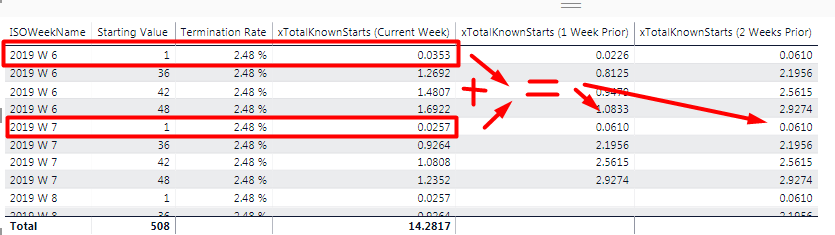
As you can see, the "2 Weeks Prior" column is totally up the first week and second week's values, when it is set to capture the results for Actual Date - 14, which should ONLY be week 6 results. Also, as you can see in the "1 Week Prior" column, some show blank altogether, though it should simply be pulling the last weeks data still, for example 2019 W 8, Shift 1, should be pulling 2019 W 7, Shift 1's values.
Ultimately, I am wondering if...
1. There is an easier solution to this compounding issue
2. If not, why am I not able to capture the prior week values with my (Prior Weeks) formulas?
Any help would be very greatly appreciated. Apologies in advance for the long-winded question. It's quite complex and I wanted to provide as much information as possible. Thanks!
-Quinn


