- Power BI forums
- Updates
- News & Announcements
- Get Help with Power BI
- Desktop
- Service
- Report Server
- Power Query
- Mobile Apps
- Developer
- DAX Commands and Tips
- Custom Visuals Development Discussion
- Health and Life Sciences
- Power BI Spanish forums
- Translated Spanish Desktop
- Power Platform Integration - Better Together!
- Power Platform Integrations (Read-only)
- Power Platform and Dynamics 365 Integrations (Read-only)
- Training and Consulting
- Instructor Led Training
- Dashboard in a Day for Women, by Women
- Galleries
- Community Connections & How-To Videos
- COVID-19 Data Stories Gallery
- Themes Gallery
- Data Stories Gallery
- R Script Showcase
- Webinars and Video Gallery
- Quick Measures Gallery
- 2021 MSBizAppsSummit Gallery
- 2020 MSBizAppsSummit Gallery
- 2019 MSBizAppsSummit Gallery
- Events
- Ideas
- Custom Visuals Ideas
- Issues
- Issues
- Events
- Upcoming Events
- Community Blog
- Power BI Community Blog
- Custom Visuals Community Blog
- Community Support
- Community Accounts & Registration
- Using the Community
- Community Feedback
Register now to learn Fabric in free live sessions led by the best Microsoft experts. From Apr 16 to May 9, in English and Spanish.
- Power BI forums
- Forums
- Get Help with Power BI
- Desktop
- Persisting a Running Total
- Subscribe to RSS Feed
- Mark Topic as New
- Mark Topic as Read
- Float this Topic for Current User
- Bookmark
- Subscribe
- Printer Friendly Page
- Mark as New
- Bookmark
- Subscribe
- Mute
- Subscribe to RSS Feed
- Permalink
- Report Inappropriate Content
Persisting a Running Total
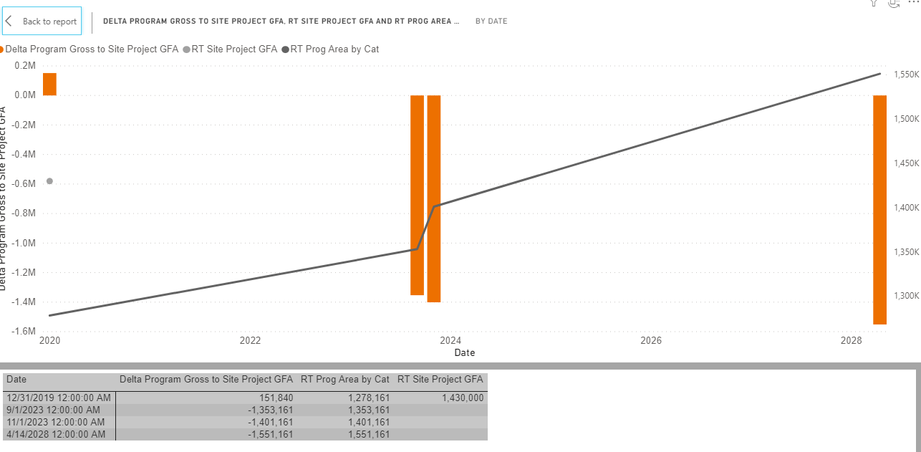
I have the following visual and the underlaying data:
[RT Program Area by Cat] is a running total measure.
[RT Site Project GFA] is another running total measure.
[Delta Program Gross to SIte Project GFA] is a measure and the difference between the two running totals.
As you can see [RT Site Project GFA] only has enough data to calculate a single point in time (12/31/2019), whereas [RT Program Area by Cat] has four data points, 12/31/19, 9/1/2020, etc... In reality [RT Site Project GFA] is static, there are no additional data points because is it hasn't and is not currently planned to change (but new data could be added later). How can I persist the RT "forward" as other data grows? This works both ways, because another scenario would be that Site GFA has more data points and Proj Area has fewer.
Can anyone point me to suggested resouces or thinking on this topic?
Thank you!
By way of an additional example, here is the same chart, but with different data.
- Mark as New
- Bookmark
- Subscribe
- Mute
- Subscribe to RSS Feed
- Permalink
- Report Inappropriate Content
@Anonymous , you can get running total like this using a date table
Cumm Sales = CALCULATE(SUM(Sales[Sales Amount]),filter(date,date[date] <=maxx(date,date[date])))
Cumm Sales = CALCULATE(SUM(Sales[Sales Amount]),filter(date,date[date] <=max(Sales[Sales Date])))
To get the best of the time intelligence function. Make sure you have a date calendar and it has been marked as the date in model view. Also, join it with the date column of your fact/s. Refer :
https://radacad.com/creating-calendar-table-in-power-bi-using-dax-functions
https://www.archerpoint.com/blog/Posts/creating-date-table-power-bi
https://www.sqlbi.com/articles/creating-a-simple-date-table-in-dax/
See if my webinar on Time Intelligence can help: https://community.powerbi.com/t5/Webinars-and-Video-Gallery/PowerBI-Time-Intelligence-Calendar-WTD-YTD-LYTD-Week-Over-Week/m-p/1051626#M184
Appreciate your Kudos.
Microsoft Power BI Learning Resources, 2023 !!
Learn Power BI - Full Course with Dec-2022, with Window, Index, Offset, 100+ Topics !!
Did I answer your question? Mark my post as a solution! Appreciate your Kudos !! Proud to be a Super User! !!
- Mark as New
- Bookmark
- Subscribe
- Mute
- Subscribe to RSS Feed
- Permalink
- Report Inappropriate Content
@amitchandak Yes, the running totals are both calculating properly, as demonstrated in the table in both screen shots. There is also a date table marked properly and joined. The issue is that its two different series of data, so even though they're joined to the same date table, the series don't "persist forward" past their last date. Now I could go back in the date hierarchy to "month" or "quarter" or "year" but then the problem becomes that you still have to have data at that "scale". If one series only has data in January and the other series has data that carries forward to November and you only drill down to quarter, you would still have the same dilema. I want/need to be able to say value "X" (the running total) persists forward for all dates, even though there are no rows of data in the fact table driving that persistence.
I hope that makes sense.
- Mark as New
- Bookmark
- Subscribe
- Mute
- Subscribe to RSS Feed
- Permalink
- Report Inappropriate Content
Hi @Anonymous ,
It's best to create a dummy .pbix file for test. Please remove sensitive information. It is suggested to upload your file to OneDrive for Business and then paste the link here.
Best Regards,
Icey
Helpful resources

Microsoft Fabric Learn Together
Covering the world! 9:00-10:30 AM Sydney, 4:00-5:30 PM CET (Paris/Berlin), 7:00-8:30 PM Mexico City

Power BI Monthly Update - April 2024
Check out the April 2024 Power BI update to learn about new features.

| User | Count |
|---|---|
| 106 | |
| 94 | |
| 75 | |
| 62 | |
| 50 |
| User | Count |
|---|---|
| 147 | |
| 106 | |
| 104 | |
| 87 | |
| 61 |


