- Power BI forums
- Updates
- News & Announcements
- Get Help with Power BI
- Desktop
- Service
- Report Server
- Power Query
- Mobile Apps
- Developer
- DAX Commands and Tips
- Custom Visuals Development Discussion
- Health and Life Sciences
- Power BI Spanish forums
- Translated Spanish Desktop
- Power Platform Integration - Better Together!
- Power Platform Integrations (Read-only)
- Power Platform and Dynamics 365 Integrations (Read-only)
- Training and Consulting
- Instructor Led Training
- Dashboard in a Day for Women, by Women
- Galleries
- Community Connections & How-To Videos
- COVID-19 Data Stories Gallery
- Themes Gallery
- Data Stories Gallery
- R Script Showcase
- Webinars and Video Gallery
- Quick Measures Gallery
- 2021 MSBizAppsSummit Gallery
- 2020 MSBizAppsSummit Gallery
- 2019 MSBizAppsSummit Gallery
- Events
- Ideas
- Custom Visuals Ideas
- Issues
- Issues
- Events
- Upcoming Events
- Community Blog
- Power BI Community Blog
- Custom Visuals Community Blog
- Community Support
- Community Accounts & Registration
- Using the Community
- Community Feedback
Register now to learn Fabric in free live sessions led by the best Microsoft experts. From Apr 16 to May 9, in English and Spanish.
- Power BI forums
- Forums
- Get Help with Power BI
- Desktop
- PYTHON INTEGRATION WITH POWER BI - IMPORTING EXCEL...
- Subscribe to RSS Feed
- Mark Topic as New
- Mark Topic as Read
- Float this Topic for Current User
- Bookmark
- Subscribe
- Printer Friendly Page
- Mark as New
- Bookmark
- Subscribe
- Mute
- Subscribe to RSS Feed
- Permalink
- Report Inappropriate Content
PYTHON INTEGRATION WITH POWER BI - IMPORTING EXCEL TO POWER BI, DATA CLEANING AND CREATING VISUALS
PYTHON INTEGRATION WITH POWER BI
IMPORTING EXCEL TO POWER BI, DATA CLEANING AND CREATING VISUALS
We all know that Python is a programming language widely used by statisticians, data scientists, and data analysts. It’s great news that it has been integrated into Power BI Desktop in Power BI Desktop August 2018 Feature Release. Once we enable the feature and install python, we can use Python script to import data source, cleaning the data, analysing the same and creating visualization with that.
Importing Excel to Power BI using Python script
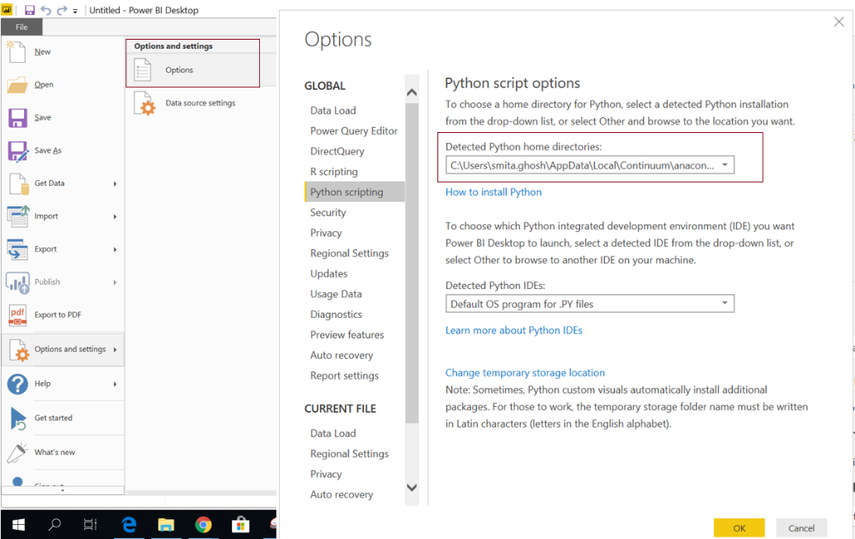
- In Power BI Desktop, We need to check if python is installed by clicking on Options and Settings -> Options -> Python scripting. If it’s installed, then it will show a path where it is installed. If not, then python installation is required. Fig 1
Fig 1
- Next, we will load excel data source using Python script. For that, first we need to click on Get Data and then select Python Script. Fig 2
Fig 2
- We will write a small Python script to load an excel dataset into Power BI desktop. For that, we will use read_excel function from pandas library by providing the path of the excel file as below. Fig 3. If we don’t have pandas installed in our system, then we need to run the below command to install pandas –
py -m pip install pandas
Fig 3
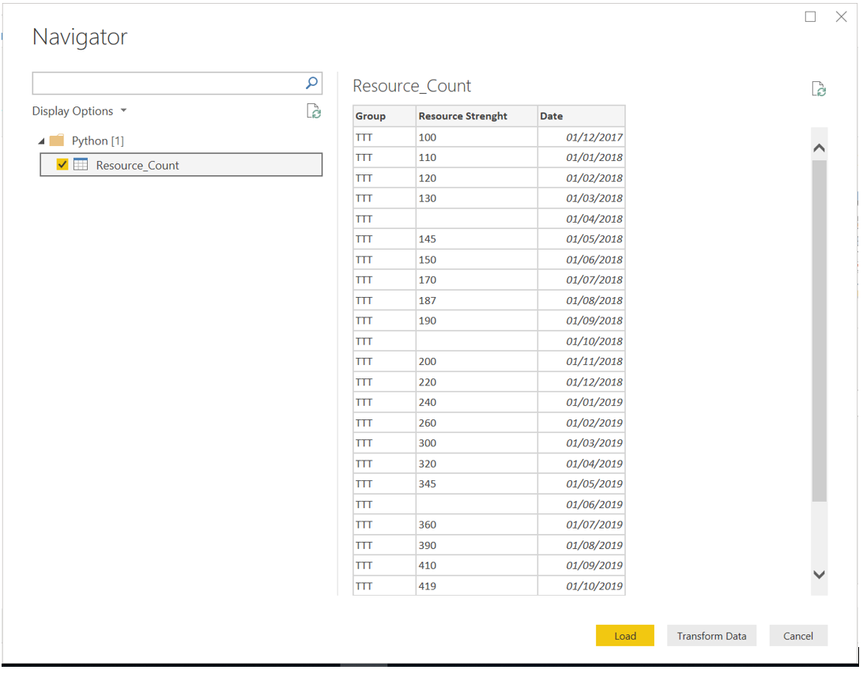
Once I click on OK, it shows the excel data into right side pane. Clicking on Load will load all data into Power BI.
Fig 4
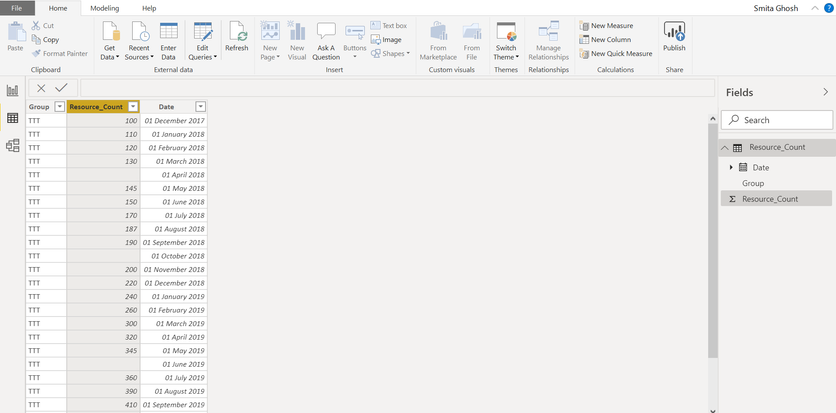
Click on Load, all the data loaded to Power BI using Python script. In Power BI Data tab, we will get the excel data as below. Fig 5
Fig 5
Data Cleaning using Python script
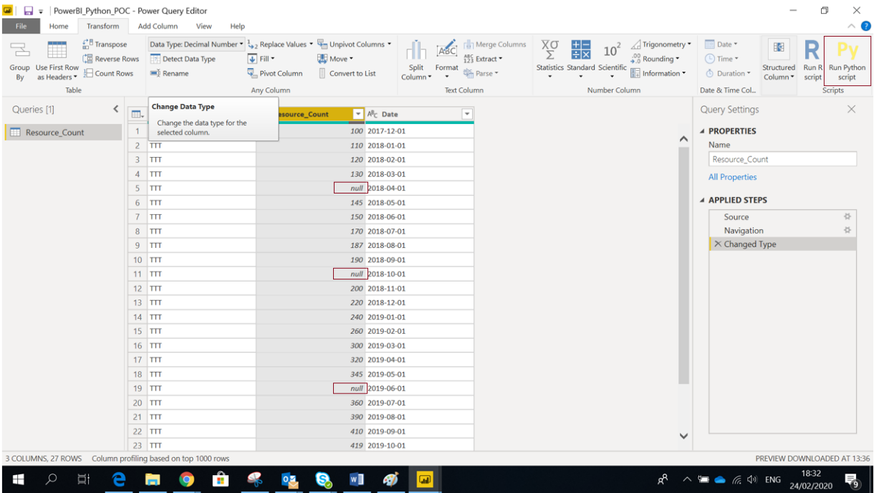
- Now I want to clean the dataset by removing the rows where there is no data in Resource_Count column. For that, I will go to Edit Query -> Transform tab. Change the Data Type of Resource_Count column to Decimal Number as below.
Fig 6
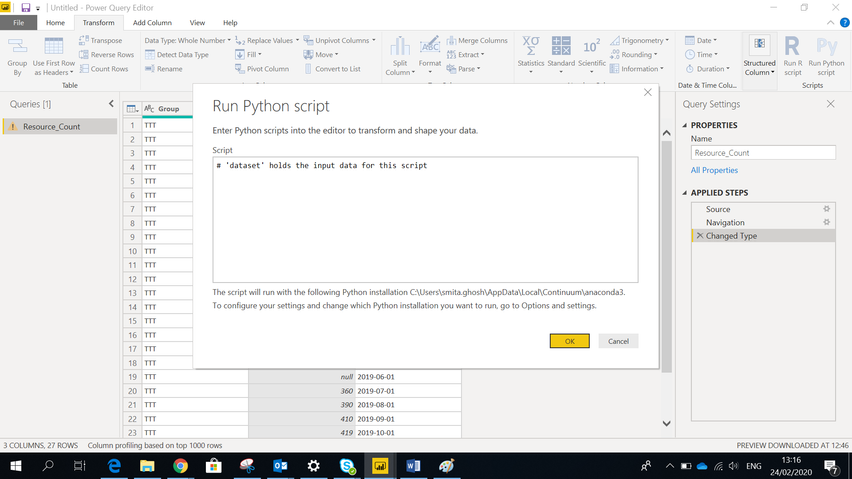
- Clicking on Run Python script, then Run Python script window comes up as below. Fig 7
Fig 7
- Clicking on OK, will create a table as below. Fig 8
Fig 8
- Clicking on the table will generate the dataset to be used in Python. Then we will run again a Python script to get rid of the rows with null data in the column Resources_Count in the dataset. Fig 9. For that, we will use a method notnull() on the dataset which will remove all rows with null value in the specified column Resource_Count in that dataset.
Fig 9
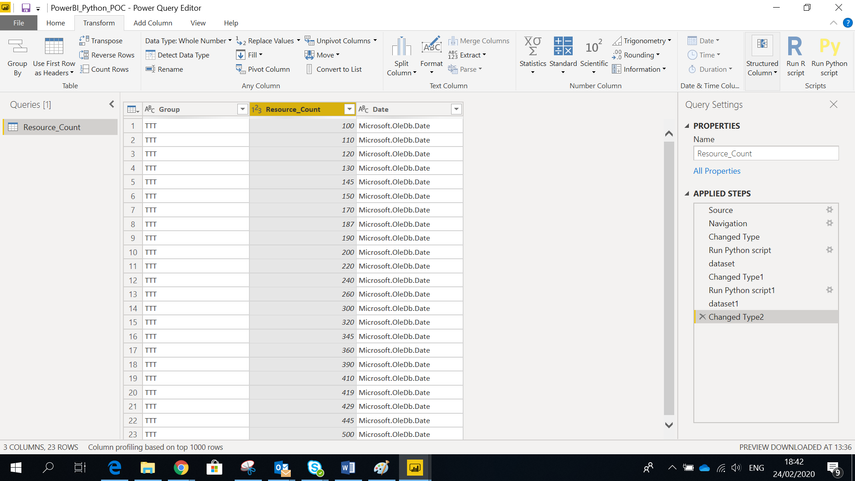
- After running this query, we are getting the result set where the rows with null data in Resource_Count column are deleted. This dataset is perfect to be used in creating different visualizations. Fig 10
Fig 10
Data Visualization using Python script
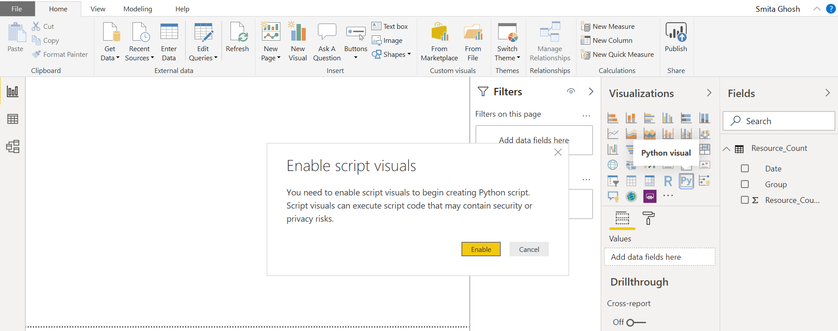
- To create visualization using python script, first step is to Enable script visuals as shown below. In the Visualizations tab, when we click on Python visual icon, we will get the popup to enable script visuals. To start with python visuals, we need to click on Enable. Fig 11
Fig 11
- After clicking on Enable, one visual area will be created as shown below. Fig 12
Fig 12
- Next step is to set the Data Fields from the table in Values. Fig 13
Fig 13
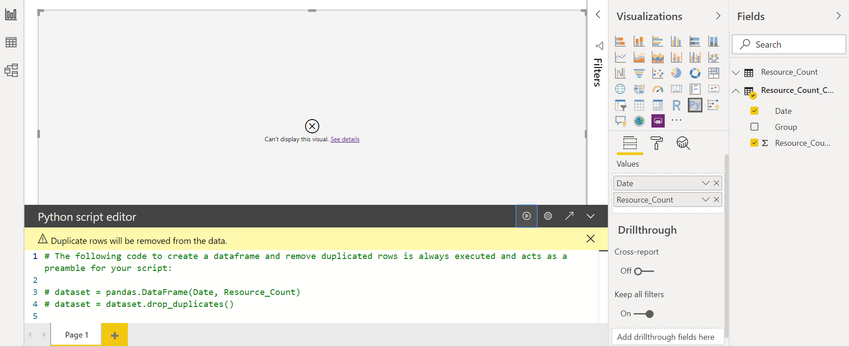
- Once we set the fields in Values, automatically Python a dataset using the fields mentioned in Values. If we open the Python script editor, we can see that code is already generated. Fig 14
Fig 14
- To create the visualization, we need to write python scripts and set the data fields. For that, we can use library matplotlib. If that library is not installed, we have to install the same in order to use the in-built functions of that library to create charts. To install matplotlib, we can use the following command –
py -m pip install matplotlib
- For me, I have already installed the same, so I can import that library as shown in line 7 and then start using the function to create a Bar chart by providing the fields which I want to bind in the chart. Fig 15
Fig 15
- We can add the label for X and Y axis by using the following script. And at last when we are done, we need to call show() in order to show that chart. Fig 16
Fig 16
- Once we are done with scripts, then we can go and hit the Run Script button. Fig 17
Fig 17
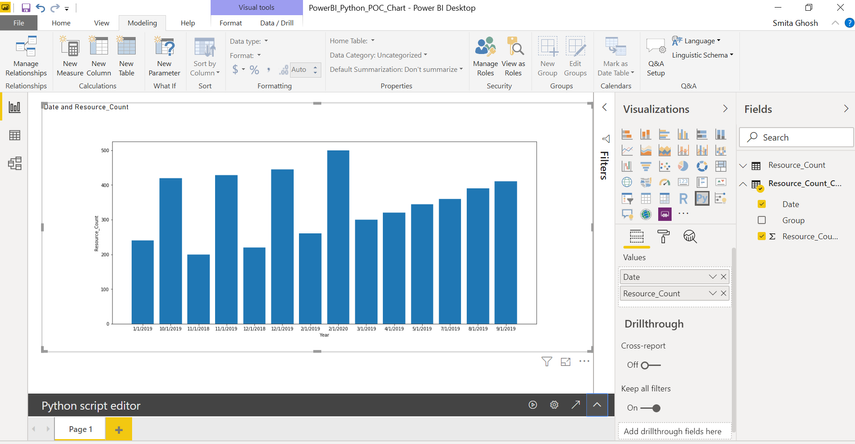
- After running the script, we will get the Bar chart with the data provided as below. Fig 18
Fig 18
Solved! Go to Solution.
- Mark as New
- Bookmark
- Subscribe
- Mute
- Subscribe to RSS Feed
- Permalink
- Report Inappropriate Content
Hi @Anonymous ,
Thanks for sharing.
Best Regards,
Jay
Community Support Team _ Jay Wang
If this post helps, then please consider Accept it as the solution to help the other members find it more quickly.
If this post helps, then please consider Accept it as the solution to help the other members find it.
- Mark as New
- Bookmark
- Subscribe
- Mute
- Subscribe to RSS Feed
- Permalink
- Report Inappropriate Content
Hi ,
How to read sharepoint data into Power BI using Python script?
I tried the most obvoius:
import pandas as pd
df= pd.read_excel(''https://xxx.sharepoint.com/:x:/t/SharepointName /EeHqIAO3Xk9Dj_7rpnzojl4BxoF9zvDF_nyQo9CKizcsCw?e=qHdsmF"='')
I tried
import sharepy
s = sharepy.connect("example.sharepoint.com")
r = s.getfile("https://example.sharepoint.com/Library/Test%20File.pdf")
I tried the office365 library
#import all the libraries
from office365.runtime.auth.authentication_context import AuthenticationContext
from office365.sharepoint.client_context import ClientContext
from office365.sharepoint.files.file import File
import io
import pandas as pd

#target url taken from sharepoint and credentials
url = 'https://company.sharepoint.com/Shared%20Documents/Folder%20Number1/Folder%20Number2/Folder3/Folder%20Number4/Target_Excel_File_v4.xlsx?cid=_Random_letters_and_numbers-21dbf74c'
username = 'Dumby_account@company.com'
password = 'Password!'

ctx_auth = AuthenticationContext(url)
if ctx_auth.acquire_token_for_user(username, password):
  ctx = ClientContext(url, ctx_auth)
  web = ctx.web
  ctx.load(web)
  ctx.execute_query()
  print("Authentication successful")

response = File.open_binary(ctx, url)

#save data to BytesIO stream
bytes_file_obj = io.BytesIO()
bytes_file_obj.write(response.content)
bytes_file_obj.seek(0) #set file object to start

#read excel file and each sheet into pandas dataframe
df = pd.read_excel(bytes_file_obj, sheetname = None)
In all cases I get an error and it is mainly because it is an organizational account sharepoint, I cannot leave my credentials in there and it is expected that other people can refresh the data model from the workspace using their own credentials.
Is there an easy way to connect to a sharepoint file from power bi using a python code? I need Python because it is the only place I can use regex easily.
Any help is welcome :-)!
- Mark as New
- Bookmark
- Subscribe
- Mute
- Subscribe to RSS Feed
- Permalink
- Report Inappropriate Content
Hi @Anonymous ,
Thanks for sharing.
Best Regards,
Jay
Community Support Team _ Jay Wang
If this post helps, then please consider Accept it as the solution to help the other members find it more quickly.
If this post helps, then please consider Accept it as the solution to help the other members find it.
Helpful resources

Microsoft Fabric Learn Together
Covering the world! 9:00-10:30 AM Sydney, 4:00-5:30 PM CET (Paris/Berlin), 7:00-8:30 PM Mexico City

Power BI Monthly Update - April 2024
Check out the April 2024 Power BI update to learn about new features.

| User | Count |
|---|---|
| 106 | |
| 93 | |
| 75 | |
| 62 | |
| 50 |
| User | Count |
|---|---|
| 147 | |
| 107 | |
| 105 | |
| 87 | |
| 61 |
