- Power BI forums
- Updates
- News & Announcements
- Get Help with Power BI
- Desktop
- Service
- Report Server
- Power Query
- Mobile Apps
- Developer
- DAX Commands and Tips
- Custom Visuals Development Discussion
- Health and Life Sciences
- Power BI Spanish forums
- Translated Spanish Desktop
- Power Platform Integration - Better Together!
- Power Platform Integrations (Read-only)
- Power Platform and Dynamics 365 Integrations (Read-only)
- Training and Consulting
- Instructor Led Training
- Dashboard in a Day for Women, by Women
- Galleries
- Community Connections & How-To Videos
- COVID-19 Data Stories Gallery
- Themes Gallery
- Data Stories Gallery
- R Script Showcase
- Webinars and Video Gallery
- Quick Measures Gallery
- 2021 MSBizAppsSummit Gallery
- 2020 MSBizAppsSummit Gallery
- 2019 MSBizAppsSummit Gallery
- Events
- Ideas
- Custom Visuals Ideas
- Issues
- Issues
- Events
- Upcoming Events
- Community Blog
- Power BI Community Blog
- Custom Visuals Community Blog
- Community Support
- Community Accounts & Registration
- Using the Community
- Community Feedback
Register now to learn Fabric in free live sessions led by the best Microsoft experts. From Apr 16 to May 9, in English and Spanish.
- Power BI forums
- Forums
- Get Help with Power BI
- Desktop
- Re: Order of rows in unpivoted table
- Subscribe to RSS Feed
- Mark Topic as New
- Mark Topic as Read
- Float this Topic for Current User
- Bookmark
- Subscribe
- Printer Friendly Page
- Mark as New
- Bookmark
- Subscribe
- Mute
- Subscribe to RSS Feed
- Permalink
- Report Inappropriate Content
Order of rows in unpivoted table
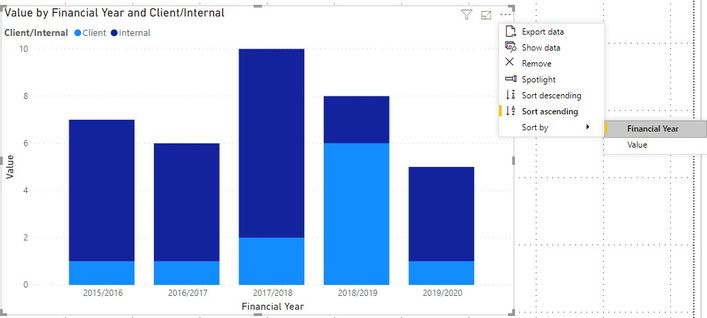
I have an unpivoted table used to create a stacked column chart. See below.
The chart does not display the Financial Years in the correct order. I added an Index column but this didn't work because the table has duplicate values (each financial year). Is there a way to get the financial years in the correct order?
Thanks
Steve
Solved! Go to Solution.
- Mark as New
- Bookmark
- Subscribe
- Mute
- Subscribe to RSS Feed
- Permalink
- Report Inappropriate Content
Hi,
My suggestion would be to split the Financial Year into 2 columns - delete the second column and rename the first column as Year. Assuming January is first month of your FY, write this calculated column formula
Date=1*("1/1/"&Data[Year])
Format this as a date column.
Now create a Calendar Table and in a calculated column of the Calendar Table, extract the Year. Build a relationship from the Date column of your Data Table to the Date column of the Calendar Table. To your visual, drag Year from the Calendar Table.
Regards,
Ashish Mathur
http://www.ashishmathur.com
https://www.linkedin.com/in/excelenthusiasts/
- Mark as New
- Bookmark
- Subscribe
- Mute
- Subscribe to RSS Feed
- Permalink
- Report Inappropriate Content
Hi,
You can change it sort by Financial Year through clicking options on this visual:
Hope this helps.
Best Regards,
Giotto Zhi
- Mark as New
- Bookmark
- Subscribe
- Mute
- Subscribe to RSS Feed
- Permalink
- Report Inappropriate Content
Thank you all for the suggested solutions. While some approaches did not seem to work initially, when I deleted the chart and rebuilt it they did work, so I am happy!
Steve
- Mark as New
- Bookmark
- Subscribe
- Mute
- Subscribe to RSS Feed
- Permalink
- Report Inappropriate Content
This is a sneaky feature of 'Sort by Column'. You either have to remove the relevant field from the visualisation and re-add it OR delete the visual and start again.
- Mark as New
- Bookmark
- Subscribe
- Mute
- Subscribe to RSS Feed
- Permalink
- Report Inappropriate Content
Hi,
My suggestion would be to split the Financial Year into 2 columns - delete the second column and rename the first column as Year. Assuming January is first month of your FY, write this calculated column formula
Date=1*("1/1/"&Data[Year])
Format this as a date column.
Now create a Calendar Table and in a calculated column of the Calendar Table, extract the Year. Build a relationship from the Date column of your Data Table to the Date column of the Calendar Table. To your visual, drag Year from the Calendar Table.
Regards,
Ashish Mathur
http://www.ashishmathur.com
https://www.linkedin.com/in/excelenthusiasts/
- Mark as New
- Bookmark
- Subscribe
- Mute
- Subscribe to RSS Feed
- Permalink
- Report Inappropriate Content
Can you create a custom sort column and mark it as sort
Microsoft Power BI Learning Resources, 2023 !!
Learn Power BI - Full Course with Dec-2022, with Window, Index, Offset, 100+ Topics !!
Did I answer your question? Mark my post as a solution! Appreciate your Kudos !! Proud to be a Super User! !!
- Mark as New
- Bookmark
- Subscribe
- Mute
- Subscribe to RSS Feed
- Permalink
- Report Inappropriate Content
How about duplicating the column, split it to get the first 4 numbers (call it start year or something). Set the data type to be number.
You can then use that with the 'Sort by Column' functionality. i.e. Select Financial Year-> Sort By Column -> start year
Helpful resources

Microsoft Fabric Learn Together
Covering the world! 9:00-10:30 AM Sydney, 4:00-5:30 PM CET (Paris/Berlin), 7:00-8:30 PM Mexico City

Power BI Monthly Update - April 2024
Check out the April 2024 Power BI update to learn about new features.

| User | Count |
|---|---|
| 111 | |
| 95 | |
| 80 | |
| 68 | |
| 59 |
| User | Count |
|---|---|
| 150 | |
| 119 | |
| 104 | |
| 87 | |
| 67 |


