- Power BI forums
- Updates
- News & Announcements
- Get Help with Power BI
- Desktop
- Service
- Report Server
- Power Query
- Mobile Apps
- Developer
- DAX Commands and Tips
- Custom Visuals Development Discussion
- Health and Life Sciences
- Power BI Spanish forums
- Translated Spanish Desktop
- Power Platform Integration - Better Together!
- Power Platform Integrations (Read-only)
- Power Platform and Dynamics 365 Integrations (Read-only)
- Training and Consulting
- Instructor Led Training
- Dashboard in a Day for Women, by Women
- Galleries
- Community Connections & How-To Videos
- COVID-19 Data Stories Gallery
- Themes Gallery
- Data Stories Gallery
- R Script Showcase
- Webinars and Video Gallery
- Quick Measures Gallery
- 2021 MSBizAppsSummit Gallery
- 2020 MSBizAppsSummit Gallery
- 2019 MSBizAppsSummit Gallery
- Events
- Ideas
- Custom Visuals Ideas
- Issues
- Issues
- Events
- Upcoming Events
- Community Blog
- Power BI Community Blog
- Custom Visuals Community Blog
- Community Support
- Community Accounts & Registration
- Using the Community
- Community Feedback
Register now to learn Fabric in free live sessions led by the best Microsoft experts. From Apr 16 to May 9, in English and Spanish.
- Power BI forums
- Forums
- Get Help with Power BI
- Desktop
- Re: Need help with converting monthly budget to da...
- Subscribe to RSS Feed
- Mark Topic as New
- Mark Topic as Read
- Float this Topic for Current User
- Bookmark
- Subscribe
- Printer Friendly Page
- Mark as New
- Bookmark
- Subscribe
- Mute
- Subscribe to RSS Feed
- Permalink
- Report Inappropriate Content
Need help with converting monthly budget to daily budget in a measure
I have data in two tables that looks like this:
Table 1
| Date | Hours |
| 01/01/2021 | 45 |
| 02/01/2021 | 72 |
| 03/01/2021 | 63 |
Table 2
| Month | Budget |
| JAN | 1500 |
| FEB | 1200 |
| MARCH | 2300 |
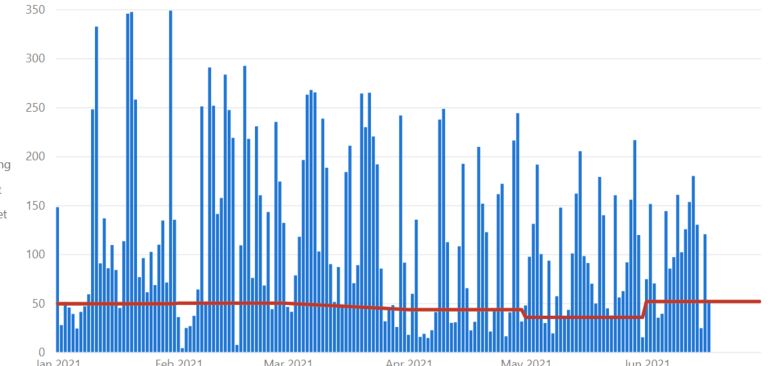
I need a measure that I can use in a visualization that will show me a BAR graph of the daily hours, and a line showing the daily budget hours.
Conceptually, the Daily Budget Hours = (Monthly Budget Hours) / (Num Days In Month)
Hopeing to recreate something like this:
I have tried the following, but it's not working and I'm not sure how else to proceed:
dailyBudget =

var budgetValue = CALCULATE(sum('Training Budget Hours'[Budget]),Dates[YearMonth])
var daysInMonth = DAY(EOMONTH(SELECTEDVALUE(Dates[Date]),0))
return divide(budgetValue,daysInMonth,0)
This is what I am hoping to achieve:
Solved! Go to Solution.
- Mark as New
- Bookmark
- Subscribe
- Mute
- Subscribe to RSS Feed
- Permalink
- Report Inappropriate Content
define
table
    Details = DATATABLE(
        "Date", DATETIME,
        "Hours", INTEGER,
        {
            {"2021-01-01", 145},
            {"2021-02-01", 172},
            {"2021-03-01", 163}
        }
    )
table
    'Monthly Budget' = DATATABLE(
        "Month", STRING,
        "Month Number", INTEGER,
        "Budget", INTEGER,
        {
            {"jan", 1, 1500},
            {"feb", 2, 1200},
            {"mar", 3, 2300}
        }
    )
EVALUATE
    ADDCOLUMNS(
        Details,
        // This will be a calculated column
        // in your Details table
        "Daily Budget",
            var CurrentDate = Details[Date]
            var MonthNumber_ = MONTH( CurrentDate )
            var MonthlyBudget =
                LOOKUPVALUE(
                    'Monthly Budget'[Budget],
                    'Monthly Budget'[Month Number],
                    MonthNumber_,
                    BLANK() -- if no value found, return BLANK
                )
            var NumOfDaysInMonth =
                COUNTROWS(
                    CALENDAR(
                        EOMONTH( CurrentDate, -1 ) + 1,
                        EOMONTH( CurrentDate, 0 )
                    )
                )
            var Result =
                DIVIDE( MonthlyBudget, NumOfDaysInMonth )
            return
                Result
    )

// Having such a column in the Details table
// enables you to get the budget for any
// period of time. Just create a measure
// that uses the calculated column "Daily Budget".- Mark as New
- Bookmark
- Subscribe
- Mute
- Subscribe to RSS Feed
- Permalink
- Report Inappropriate Content
define
table
    Details = DATATABLE(
        "Date", DATETIME,
        "Hours", INTEGER,
        {
            {"2021-01-01", 145},
            {"2021-02-01", 172},
            {"2021-03-01", 163}
        }
    )
table
    'Monthly Budget' = DATATABLE(
        "Month", STRING,
        "Month Number", INTEGER,
        "Budget", INTEGER,
        {
            {"jan", 1, 1500},
            {"feb", 2, 1200},
            {"mar", 3, 2300}
        }
    )
EVALUATE
    ADDCOLUMNS(
        Details,
        // This will be a calculated column
        // in your Details table
        "Daily Budget",
            var CurrentDate = Details[Date]
            var MonthNumber_ = MONTH( CurrentDate )
            var MonthlyBudget =
                LOOKUPVALUE(
                    'Monthly Budget'[Budget],
                    'Monthly Budget'[Month Number],
                    MonthNumber_,
                    BLANK() -- if no value found, return BLANK
                )
            var NumOfDaysInMonth =
                COUNTROWS(
                    CALENDAR(
                        EOMONTH( CurrentDate, -1 ) + 1,
                        EOMONTH( CurrentDate, 0 )
                    )
                )
            var Result =
                DIVIDE( MonthlyBudget, NumOfDaysInMonth )
            return
                Result
    )

// Having such a column in the Details table
// enables you to get the budget for any
// period of time. Just create a measure
// that uses the calculated column "Daily Budget".Helpful resources

Microsoft Fabric Learn Together
Covering the world! 9:00-10:30 AM Sydney, 4:00-5:30 PM CET (Paris/Berlin), 7:00-8:30 PM Mexico City

Power BI Monthly Update - April 2024
Check out the April 2024 Power BI update to learn about new features.

| User | Count |
|---|---|
| 111 | |
| 100 | |
| 80 | |
| 64 | |
| 58 |
| User | Count |
|---|---|
| 146 | |
| 110 | |
| 93 | |
| 84 | |
| 67 |

