- Power BI forums
- Updates
- News & Announcements
- Get Help with Power BI
- Desktop
- Service
- Report Server
- Power Query
- Mobile Apps
- Developer
- DAX Commands and Tips
- Custom Visuals Development Discussion
- Health and Life Sciences
- Power BI Spanish forums
- Translated Spanish Desktop
- Power Platform Integration - Better Together!
- Power Platform Integrations (Read-only)
- Power Platform and Dynamics 365 Integrations (Read-only)
- Training and Consulting
- Instructor Led Training
- Dashboard in a Day for Women, by Women
- Galleries
- Community Connections & How-To Videos
- COVID-19 Data Stories Gallery
- Themes Gallery
- Data Stories Gallery
- R Script Showcase
- Webinars and Video Gallery
- Quick Measures Gallery
- 2021 MSBizAppsSummit Gallery
- 2020 MSBizAppsSummit Gallery
- 2019 MSBizAppsSummit Gallery
- Events
- Ideas
- Custom Visuals Ideas
- Issues
- Issues
- Events
- Upcoming Events
- Community Blog
- Power BI Community Blog
- Custom Visuals Community Blog
- Community Support
- Community Accounts & Registration
- Using the Community
- Community Feedback
Register now to learn Fabric in free live sessions led by the best Microsoft experts. From Apr 16 to May 9, in English and Spanish.
- Power BI forums
- Forums
- Get Help with Power BI
- Desktop
- Re: Need help on building histogram
- Subscribe to RSS Feed
- Mark Topic as New
- Mark Topic as Read
- Float this Topic for Current User
- Bookmark
- Subscribe
- Printer Friendly Page
- Mark as New
- Bookmark
- Subscribe
- Mute
- Subscribe to RSS Feed
- Permalink
- Report Inappropriate Content
Need help on building histogram
Newbie question. My company blocks youtube, emails, dropbox etc. thus I won't be able to watch training vedios neither upload my test file.
If I have following data:
| F_ID | D_ID | CaseID | Service_Date | Event_Date |
| 34 | 34 | 1268595760 | 10/28/2012 | 3/17/2017 20:28 |
| 34 | 34 | 1167721755 | 10/28/2012 | 2/1/2011 15:32 |
| 34 | 34 | 1189270952 | 10/28/2012 | 6/11/2012 14:25 |
| 34 | 34 | 1157838938 | 10/28/2012 | 5/24/2010 14:14 |
| 34 | 34 | 1271928539 | 10/28/2012 | 5/2/2017 18:48 |
| 34 | 34 | 1208328814 | 10/28/2012 | 6/29/2013 2:30 |
| 34 | 34 | 1212990857 | 10/28/2012 | 10/28/2013 14:27 |
| 34 | 34 | 1286143409 | 10/28/2012 | 2/21/2018 0:10 |
| 34 | 34 | 1286354300 | 10/28/2012 | 2/24/2018 18:24 |
| 34 | 34 | 1286364230 | 10/28/2012 | 2/24/2018 18:25 |
| 34 | 34 | 1168059793 | 10/28/2012 | 2/7/2011 7:40 |
| 34 | 34 | 1148812384 | 10/28/2012 | 9/6/2009 11:21 |
| 34 | 34 | 1146986351 | 10/28/2012 | 7/26/2009 21:33 |
| 1501A | 1501A | 1175678621 | 2/26/2012 | 9/16/2010 1:14 |
| 1501A | 1501A | 1150850369 | 2/26/2012 | 6/28/2011 6:00 |
| 1501A | 1501A | 1143953319 | 2/26/2012 | 5/10/2011 6:37 |
| 1501A | 1501A | 1273502714 | 2/26/2012 | 10/27/2009 3:01 |
| 1501A | 1501A | 1234691539 | 2/26/2012 | 6/4/2009 16:22 |
| 1501A | 1501A | 1280790926 | 2/26/2012 | 5/27/2017 6:48 |
| 1501A | 1501A | 1293269802 | 2/26/2012 | 3/22/2015 16:02 |
| 1501A | 1501A | 1273093097 | 2/26/2012 | 10/3/2017 14:03 |
| 1501A | 1501A | 1269236863 | 2/26/2012 | 7/10/2018 19:15 |
| 1501A | 1501A | 1254542113 | 2/26/2012 | 8/20/2016 16:51 |
| 1501A | 1501A | 1254536296 | 2/26/2012 | 3/22/2015 16:02 |
| 1501A | 6R21 | 1163538299 | 12/27/2012 | 6/20/2010 15:22 |
| 1501A | 6R21 | 1173059549 | 12/27/2012 | 5/20/2017 3:11 |
| 1501A | 6R21 | 1261287002 | 12/27/2012 | 3/29/2017 23:38 |
| 1501A | 6R21 | 1234695882 | 12/27/2012 | 5/20/2016 22:18 |
| 1501A | 6R21 | 1159251670 | 12/27/2012 | 5/20/2016 19:39 |
| A162 | 11233 | 1150521845 | 2/7/2012 | 10/15/2009 7:26 |
| A162 | 11233 | 1211848627 | 2/7/2012 | 9/20/2013 16:07 |
| A162 | 11233 | 1163008126 | 2/7/2012 | 9/20/2013 14:25 |
| A162 | 11233 | 1281904735 | 2/7/2012 | 1/11/2010 15:02 |
| A162 | 2X29 | 1153375344 | 1/22/2012 | 1/11/2010 16:16 |
| A162 | 2X29 | 1151015346 | 1/22/2012 | 8/31/2010 16:00 |
| A162 | 2X29 | 1234955452 | 1/22/2012 | 1/11/2010 16:17 |
| A162 | 2X29 | 1212687449 | 1/22/2012 | 10/30/2009 0:10 |
| A162 | 2X29 | 1239934078 | 1/22/2012 | 4/2/2009 8:13 |
| A162 | 2X29 | 1235060901 | 1/22/2012 | 4/2/2015 10:16 |
| A162 | 2X29 | 1201793596 | 1/22/2012 | 10/16/2013 4:59 |
| A162 | 2X29 | 1166198647 | 1/22/2012 | 6/7/2015 12:06 |
| A162 | A162 | 1211837567 | 7/9/2012 | 4/5/2012 19:58 |
| A162 | A162 | 1153370128 | 7/9/2012 | 1/10/2011 6:54 |
| A162 | A162 | 1153373149 | 7/9/2012 | 12/12/2010 14:12 |
This is what I want:
1. When talking about event-date and service_date, it is for each unique F_ID and D_ID combination. Do I need to cencatenate these two field? I still want to keep the two column seperate for future filtering purpose, but when I do the following count, it is for each unique combinated F_ID + D_ID, I will call Device now.
2. So for each Device, I would like to count how many events happened after its service date. It would be:
| F_ID | D_ID | Event_Count after Service_Date |
| 34 | 34 | 7 |
| 1501A | 1501A | 6 |
| 1501A | 6R21 | 4 |
| A162 | 11233 | 2 |
| A162 | 2X29 | 3 |
| A162 | A162 | 0 |
3. Now I would like to make a graph:
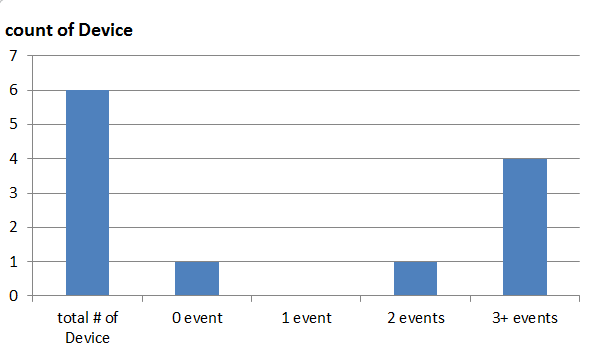
The first bar shows the total number of Devices, the second bar shows how many deivce had 0 event after service date, the third bar shows how many device had 1 event after service date, etc. ...
Thank you!
Solved! Go to Solution.
- Mark as New
- Bookmark
- Subscribe
- Mute
- Subscribe to RSS Feed
- Permalink
- Report Inappropriate Content
Hi @f_young2018
I don't think you can do your full scenario with the total number of devices next to the distribution of event counts, but I can show you a (convoluted) way to get the events grouped and displayed as you require.
First add a new table to your model, called Events
Events
0 Events
1 Event
2 Events
3+ Events
Then create a calculated table to contain the summarized data, along with some concatenation work.
DeviceSummary =
SUMMARIZE (
    Devices,
    Devices[F_ID],
    Devices[D_ID],
    "Event Count", CONCATENATE (  //This is basically if nothing, give 0, if 1 or 2 give the number, if > 3 give 3+
        IF (
            ISBLANK (
                CALCULATE (
                    COUNT ( Devices[CaseID] ),
                    FILTER ( Devices, Devices[Event_Date] > Devices[Service_Date] )
                )
            ),
            0,
            IF (
                CALCULATE (
                    COUNT ( Devices[CaseID] ),
                    FILTER ( Devices, Devices[Event_Date] > Devices[Service_Date] )
                )
                    < 3,
                CALCULATE (
                    COUNT ( Devices[CaseID] ),
                    FILTER ( Devices, Devices[Event_Date] > Devices[Service_Date] )
                ),
                "3+"
            )
        ),
        " Events"
    ),
    "Device ID", CONCATENATE ( Devices[F_ID], CONCATENATE ( "-", Devices[D_ID] ) )
)
Go into your model and link Events[Events] with DeviceSummary[Event Count].
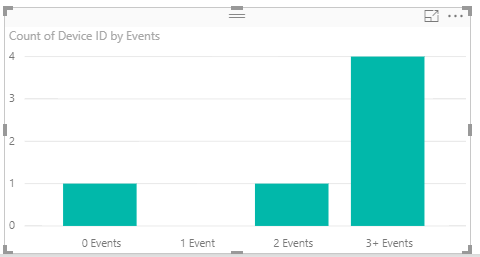
Finally, make a column chart with Events[Events] as the X-axis and DeviceSummary[Device ID] as the value (it will default to count). On the dropdown for Events, choose "Show items with no data". Sort the visual by Events ascending and voila.
You can apply slicers on F_ID and/or D_ID to this visual and it will react accordingly, since we have those values in the summary table.
Hope this helps
David
- Mark as New
- Bookmark
- Subscribe
- Mute
- Subscribe to RSS Feed
- Permalink
- Report Inappropriate Content
Hi David, thank you so much!!
Helpful resources

Microsoft Fabric Learn Together
Covering the world! 9:00-10:30 AM Sydney, 4:00-5:30 PM CET (Paris/Berlin), 7:00-8:30 PM Mexico City

Power BI Monthly Update - April 2024
Check out the April 2024 Power BI update to learn about new features.

| User | Count |
|---|---|
| 107 | |
| 93 | |
| 77 | |
| 65 | |
| 53 |
| User | Count |
|---|---|
| 147 | |
| 106 | |
| 104 | |
| 87 | |
| 61 |


