- Power BI forums
- Updates
- News & Announcements
- Get Help with Power BI
- Desktop
- Service
- Report Server
- Power Query
- Mobile Apps
- Developer
- DAX Commands and Tips
- Custom Visuals Development Discussion
- Health and Life Sciences
- Power BI Spanish forums
- Translated Spanish Desktop
- Power Platform Integration - Better Together!
- Power Platform Integrations (Read-only)
- Power Platform and Dynamics 365 Integrations (Read-only)
- Training and Consulting
- Instructor Led Training
- Dashboard in a Day for Women, by Women
- Galleries
- Community Connections & How-To Videos
- COVID-19 Data Stories Gallery
- Themes Gallery
- Data Stories Gallery
- R Script Showcase
- Webinars and Video Gallery
- Quick Measures Gallery
- 2021 MSBizAppsSummit Gallery
- 2020 MSBizAppsSummit Gallery
- 2019 MSBizAppsSummit Gallery
- Events
- Ideas
- Custom Visuals Ideas
- Issues
- Issues
- Events
- Upcoming Events
- Community Blog
- Power BI Community Blog
- Custom Visuals Community Blog
- Community Support
- Community Accounts & Registration
- Using the Community
- Community Feedback
Register now to learn Fabric in free live sessions led by the best Microsoft experts. From Apr 16 to May 9, in English and Spanish.
- Power BI forums
- Forums
- Get Help with Power BI
- Desktop
- Re: Need help calculating totals and weekly percen...
- Subscribe to RSS Feed
- Mark Topic as New
- Mark Topic as Read
- Float this Topic for Current User
- Bookmark
- Subscribe
- Printer Friendly Page
- Mark as New
- Bookmark
- Subscribe
- Mute
- Subscribe to RSS Feed
- Permalink
- Report Inappropriate Content
Need help calculating totals and weekly percentages for groups.
Hi all,
I need help with some measures please. I'm creating a report that shows the number of available appointments and room capacity utilisation %, based on data from booking system.
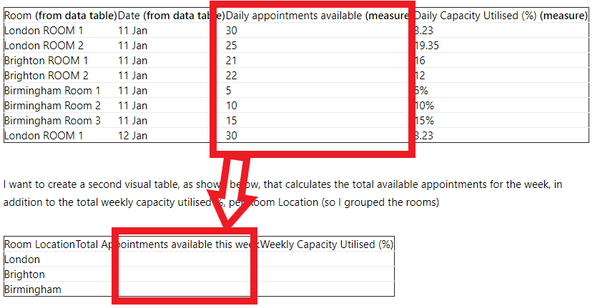
I have created a table visual in my report as shown below. Please note in the table there is a row for each room per day of the current week (for example 11-17 Jan).
| Room (from data table) | Date (from data table) | Daily appointments available (measure) | Daily Capacity Utilised (%) (measure) |
| London ROOM 1 | 11 Jan | 30 | 3.23 |
| London ROOM 2 | 11 Jan | 25 | 19.35 |
| Brighton ROOM 1 | 11 Jan | 21 | 16 |
| Brighton ROOM 2 | 11 Jan | 22 | 12 |
| Birmingham Room 1 | 11 Jan | 5 | 5% |
| Birmingham Room 2 | 11 Jan | 10 | 10% |
| Birmingham Room 3 | 11 Jan | 15 | 15% |
| London ROOM 1 | 12 Jan | 30 | 3.23 |
I want to create a second visual table, as shown below, that calculates the total available appointments for the week, in addition to the total weekly capacity utilised %, per Room Location (so I grouped the rooms)
| Room Location | Total Appointments available this week | Weekly Capacity Utilised (%) |
| London | ||
| Brighton | ||
| Birmingham |
I need help with the measures for this please.
Please note the London room is open 7 days a week, Brighton 6 days, and Birmingham 5 days.
Thanks.
- Mark as New
- Bookmark
- Subscribe
- Mute
- Subscribe to RSS Feed
- Permalink
- Report Inappropriate Content
Hi, @Anonymous
Please show your relevant measures' formulas.
If possible , can you upload a sample pbix to OneDrive and share the link here for test?
You can take a try formula as below:
Measure2_Daily appointments available = sumx('Table',[Measure_Daily appointments available])
Best Regards,
Community Support Team _ Eason
- Mark as New
- Bookmark
- Subscribe
- Mute
- Subscribe to RSS Feed
- Permalink
- Report Inappropriate Content
Hi @amitchandak
Thanks for your reply.
I should have mentioned that the underlying data only contains appointments for the current week, so theres no need to distinguish which week the appointment is for. Essentially what I need is for the numbers in the below column to be totaled up (by room location, for example London).
I've tried to create a measure like the one you suggested to do this, but its my understanding I can't use sum for a measure. How do I sum measures?
Additionally, I need help with the second column, which works out the total capacity utilised. If you could give me any pointers on this id really appreciate it.
Thanks!
- Mark as New
- Bookmark
- Subscribe
- Mute
- Subscribe to RSS Feed
- Permalink
- Report Inappropriate Content
@Anonymous , if available this week is ums from daily. You can have week in you date table and create the measures
example with help from date table
new columns in date table
Week Start date = 'Date'[Date]+-1*WEEKDAY('Date'[Date],2)+1
Week End date = 'Date'[Date]+ 7-1*WEEKDAY('Date'[Date],2)
Week Rank = RANKX(all('Date'),'Date'[Week Start date],,ASC,Dense)
or
Week Rank = RANKX(all('Date'),'Date'[Year Week],,ASC,Dense) //YYYYMM format
measures example
This Week = CALCULATE(sum('order'[Qty]), FILTER(ALL('Date'),'Date'[Week Rank]=max('Date'[Week Rank])))
Last Week = CALCULATE(sum('order'[Qty]), FILTER(ALL('Date'),'Date'[Week Rank]=max('Date'[Week Rank])-1))
Microsoft Power BI Learning Resources, 2023 !!
Learn Power BI - Full Course with Dec-2022, with Window, Index, Offset, 100+ Topics !!
Did I answer your question? Mark my post as a solution! Appreciate your Kudos !! Proud to be a Super User! !!
Helpful resources

Microsoft Fabric Learn Together
Covering the world! 9:00-10:30 AM Sydney, 4:00-5:30 PM CET (Paris/Berlin), 7:00-8:30 PM Mexico City

Power BI Monthly Update - April 2024
Check out the April 2024 Power BI update to learn about new features.

| User | Count |
|---|---|
| 109 | |
| 99 | |
| 77 | |
| 66 | |
| 54 |
| User | Count |
|---|---|
| 144 | |
| 104 | |
| 102 | |
| 88 | |
| 63 |

