- Power BI forums
- Updates
- News & Announcements
- Get Help with Power BI
- Desktop
- Service
- Report Server
- Power Query
- Mobile Apps
- Developer
- DAX Commands and Tips
- Custom Visuals Development Discussion
- Health and Life Sciences
- Power BI Spanish forums
- Translated Spanish Desktop
- Power Platform Integration - Better Together!
- Power Platform Integrations (Read-only)
- Power Platform and Dynamics 365 Integrations (Read-only)
- Training and Consulting
- Instructor Led Training
- Dashboard in a Day for Women, by Women
- Galleries
- Community Connections & How-To Videos
- COVID-19 Data Stories Gallery
- Themes Gallery
- Data Stories Gallery
- R Script Showcase
- Webinars and Video Gallery
- Quick Measures Gallery
- 2021 MSBizAppsSummit Gallery
- 2020 MSBizAppsSummit Gallery
- 2019 MSBizAppsSummit Gallery
- Events
- Ideas
- Custom Visuals Ideas
- Issues
- Issues
- Events
- Upcoming Events
- Community Blog
- Power BI Community Blog
- Custom Visuals Community Blog
- Community Support
- Community Accounts & Registration
- Using the Community
- Community Feedback
Register now to learn Fabric in free live sessions led by the best Microsoft experts. From Apr 16 to May 9, in English and Spanish.
- Power BI forums
- Forums
- Get Help with Power BI
- Desktop
- Multiple slicers and information accuracy
- Subscribe to RSS Feed
- Mark Topic as New
- Mark Topic as Read
- Float this Topic for Current User
- Bookmark
- Subscribe
- Printer Friendly Page
- Mark as New
- Bookmark
- Subscribe
- Mute
- Subscribe to RSS Feed
- Permalink
- Report Inappropriate Content
Multiple slicers and information accuracy
Hi,
We have a report that we're trying to put together that originates from 3 different sources.
- Budget file, includes expected patient volume by surgeon, and includes surgeon specialty
- Patient file, includes patient level data, including a patient ID, expected revenue, etc.
- OR actuals file, also includes the patient IDs, surgeon, specialty, setting (Inpatient or Outpatient), etc.
At the moment we're running into an issue with how the data comes together to roll up from surgeon -> specialty -> expected revenue impact, depending on the various slicers selected.
I'll try to demonstrate the issue using only the Inpatient (IP) and Outpatient (OP) slicer:
First is "all'in" view:
Selecting IP only:
Selecting OP only:
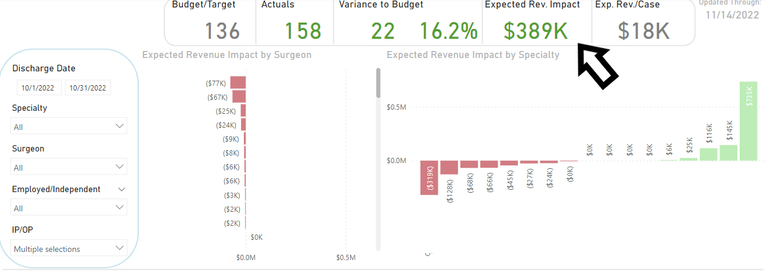
You see that the issue is that the "Expected Rev. Impact" card doesn't make sense if you sum the IP and OP results together.
389k + -338k <> -308k
The card is simply presenting the result of a measure that's looking at the "Variance to Budget" count and multiplying that against the "Exp. Rev/Case". And that Exp. Rev/Case is just the average of all expected payments within the selected slicer settings. What that card needs to show, is to show a sum of the average expected payments by surgeon...and roll up from there. And it needs to be able to do that based on whatever the slicer input combination might be.
Sorry if this isn't super clear, but hopefully it's a good starting point for seeking some help!
Thanks!
- Mark as New
- Bookmark
- Subscribe
- Mute
- Subscribe to RSS Feed
- Permalink
- Report Inappropriate Content
Just exclude the names and make sure that IDs cant identify anyone.
I dont need all the data, just enough to show the pornlem and help build you a solution.
I am happy to help with Dax but I wont faff about creating test data.
If you put in the effort or providing a sample PBIX then you get help on this forum.
Solvers on this forum love problems like this.
- Mark as New
- Bookmark
- Subscribe
- Mute
- Subscribe to RSS Feed
- Permalink
- Report Inappropriate Content
We want to help you but your description is too vaugue.
Provide example pbix, so we can see the data, relationships and measures.
Use "enter data" to copy and paste upto 500 rows in the pbix, otherwise we wont have the credentials to access the source data. Then copy the pbix to onedrive, share it and post the link in this chat like this
Remember not to share private data ... we don't want you to get into trouble. 😧
You will get a quicker response if you put time and effo into providing an example pbix.
Vaugue descriptions can waste your time and ourtime.
Look foward to helping you when the above information is forthcoming
- Mark as New
- Bookmark
- Subscribe
- Mute
- Subscribe to RSS Feed
- Permalink
- Report Inappropriate Content
That's the hard part, given that there's patient data tied to all of this. Makes it difficult to make it deinditified....and still useful.
Helpful resources

Microsoft Fabric Learn Together
Covering the world! 9:00-10:30 AM Sydney, 4:00-5:30 PM CET (Paris/Berlin), 7:00-8:30 PM Mexico City

Power BI Monthly Update - April 2024
Check out the April 2024 Power BI update to learn about new features.

| User | Count |
|---|---|
| 115 | |
| 99 | |
| 86 | |
| 70 | |
| 62 |
| User | Count |
|---|---|
| 151 | |
| 120 | |
| 103 | |
| 87 | |
| 68 |


