- Power BI forums
- Updates
- News & Announcements
- Get Help with Power BI
- Desktop
- Service
- Report Server
- Power Query
- Mobile Apps
- Developer
- DAX Commands and Tips
- Custom Visuals Development Discussion
- Health and Life Sciences
- Power BI Spanish forums
- Translated Spanish Desktop
- Power Platform Integration - Better Together!
- Power Platform Integrations (Read-only)
- Power Platform and Dynamics 365 Integrations (Read-only)
- Training and Consulting
- Instructor Led Training
- Dashboard in a Day for Women, by Women
- Galleries
- Community Connections & How-To Videos
- COVID-19 Data Stories Gallery
- Themes Gallery
- Data Stories Gallery
- R Script Showcase
- Webinars and Video Gallery
- Quick Measures Gallery
- 2021 MSBizAppsSummit Gallery
- 2020 MSBizAppsSummit Gallery
- 2019 MSBizAppsSummit Gallery
- Events
- Ideas
- Custom Visuals Ideas
- Issues
- Issues
- Events
- Upcoming Events
- Community Blog
- Power BI Community Blog
- Custom Visuals Community Blog
- Community Support
- Community Accounts & Registration
- Using the Community
- Community Feedback
Register now to learn Fabric in free live sessions led by the best Microsoft experts. From Apr 16 to May 9, in English and Spanish.
- Power BI forums
- Forums
- Get Help with Power BI
- Desktop
- Re: Multiple Fact Tables
- Subscribe to RSS Feed
- Mark Topic as New
- Mark Topic as Read
- Float this Topic for Current User
- Bookmark
- Subscribe
- Printer Friendly Page
- Mark as New
- Bookmark
- Subscribe
- Mute
- Subscribe to RSS Feed
- Permalink
- Report Inappropriate Content
Multiple Fact Tables
2 parter here
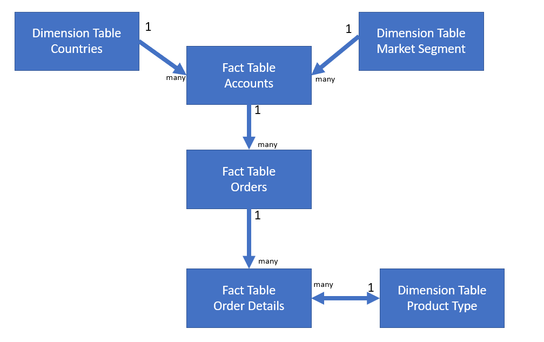
I have multiple fact tables and I'm looking to build a report that can pull pieces from each of them. The model looks as follows:
I don't think there are any chasm/fan traps in there, as each order has an associated order, which has an associated account.
When I pull Total Revenue from Orders and count of Account name by countries/market segments I get the model working as it should. However, if I also put in order type from Orders, the model doesn't seem to like that.
Looking good (sc_name from countries table, name from accounts table)):
Looking not so good:
You see repeating values in the count of account name, and blanks showing up for order status where there's no rev.
I feel like I'm doing something in my model wrong?
Further to this, I want the model to be able to pull from Order Details, and eventually look like the below, which I know will compound the problem.
Thanks for your help!
Z
Solved! Go to Solution.
- Mark as New
- Bookmark
- Subscribe
- Mute
- Subscribe to RSS Feed
- Permalink
- Report Inappropriate Content
@zskolnik Yup, you'll need to get into some fun DAX expressions.
Basically, you're doing to need to use DAX to add a series of MEASURES to your data which in effect pull the information from that bottom most FACT table.
Start with this one:
Please @mention me in your reply if you want a response.
Copying DAX from this post? Click here for a hack to quickly replace it with your own table names
Has this post solved your problem? Please Accept as Solution so that others can find it quickly and to let the community know your problem has been solved.
If you found this post helpful, please give Kudos C
I work as a Microsoft trainer and consultant, specialising in Power BI and Power Query.
www.excelwithallison.com
- Mark as New
- Bookmark
- Subscribe
- Mute
- Subscribe to RSS Feed
- Permalink
- Report Inappropriate Content
@zskolnik , At a high level the model seems fine, but need to check for calculation and how it there in power bi
Can you share sample data and sample output in table format? Or a sample pbix after removing sensitive data.
Microsoft Power BI Learning Resources, 2023 !!
Learn Power BI - Full Course with Dec-2022, with Window, Index, Offset, 100+ Topics !!
Did I answer your question? Mark my post as a solution! Appreciate your Kudos !! Proud to be a Super User! !!
- Mark as New
- Bookmark
- Subscribe
- Mute
- Subscribe to RSS Feed
- Permalink
- Report Inappropriate Content
Can you share redacted screenshot of actual data or maybe sample report with the dummy data you've provided?
Couple of questions:
1) I feel like the Count of Name in the Not looking so good sample should be 3 repeated, not 1???
2) What visual type are you trying to use? Table or Matrix or other??
The reason you have this problem is because you're trying to put Accounts in the Value field, when the cross filter direction doesn't allow for it. With your current model setup, you have to look at the bottom most Fact table that you are using in the current visual, and that is the ONLY fact table that can have aggregations on it or go in VALUES of any visual.
Two options:
1) Use COUNT of Account ID from the Orders table instead of Count of Name from the Accounts table.
2) Change the cross filter direction to BOTH on the relationships (careful though as this has other implications so you should read up and understand this before choosing it as best solution).
Please @mention me in your reply if you want a response.
Copying DAX from this post? Click here for a hack to quickly replace it with your own table names
Has this post solved your problem? Please Accept as Solution so that others can find it quickly and to let the community know your problem has been solved.
If you found this post helpful, please give Kudos C
I work as a Microsoft trainer and consultant, specialising in Power BI and Power Query.
www.excelwithallison.com
- Mark as New
- Bookmark
- Subscribe
- Mute
- Subscribe to RSS Feed
- Permalink
- Report Inappropriate Content
Thanks for the response Allison!
Below is some dummy data that should help. 1) You're correct in that in my sample before the count should have been 3 and not 1. My mistake. 2) Ideally a matrix
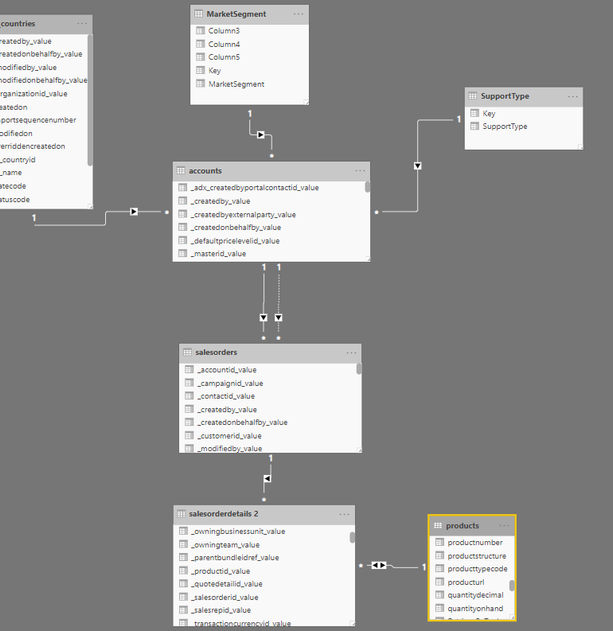
Your explanation below, that only the bottom-most fact table can be an input to the values column helps, and that would explain why it wasn't working. Your idea to use count from the orders table does work (as seen below - account id is from accounts, customer id from order), thank you for that! However, I would then run into difficulties when I go one level down to the salesorderdetails table, as I'd like to figure out what specific products make up that order (from the products table).
As would be expected, if I drop in the names of our products from the product table into rows, I get all our products below which clearly breaks the model. I wouldn't like to use bidirectional filters as I am now for reasons that you mentioned.
Any ideas how I could find what products make up the orders from France with an accurate customer count?
Thanks,
Z
Matrix working down to orders
Matrix breaking on products
Model
- Mark as New
- Bookmark
- Subscribe
- Mute
- Subscribe to RSS Feed
- Permalink
- Report Inappropriate Content
@zskolnik Yup, you'll need to get into some fun DAX expressions.
Basically, you're doing to need to use DAX to add a series of MEASURES to your data which in effect pull the information from that bottom most FACT table.
Start with this one:
Please @mention me in your reply if you want a response.
Copying DAX from this post? Click here for a hack to quickly replace it with your own table names
Has this post solved your problem? Please Accept as Solution so that others can find it quickly and to let the community know your problem has been solved.
If you found this post helpful, please give Kudos C
I work as a Microsoft trainer and consultant, specialising in Power BI and Power Query.
www.excelwithallison.com
- Mark as New
- Bookmark
- Subscribe
- Mute
- Subscribe to RSS Feed
- Permalink
- Report Inappropriate Content
Sounds about right. Thank you for the responses!
Helpful resources

Microsoft Fabric Learn Together
Covering the world! 9:00-10:30 AM Sydney, 4:00-5:30 PM CET (Paris/Berlin), 7:00-8:30 PM Mexico City

Power BI Monthly Update - April 2024
Check out the April 2024 Power BI update to learn about new features.

| User | Count |
|---|---|
| 106 | |
| 93 | |
| 75 | |
| 62 | |
| 50 |
| User | Count |
|---|---|
| 147 | |
| 107 | |
| 105 | |
| 87 | |
| 61 |


