- Power BI forums
- Updates
- News & Announcements
- Get Help with Power BI
- Desktop
- Service
- Report Server
- Power Query
- Mobile Apps
- Developer
- DAX Commands and Tips
- Custom Visuals Development Discussion
- Health and Life Sciences
- Power BI Spanish forums
- Translated Spanish Desktop
- Power Platform Integration - Better Together!
- Power Platform Integrations (Read-only)
- Power Platform and Dynamics 365 Integrations (Read-only)
- Training and Consulting
- Instructor Led Training
- Dashboard in a Day for Women, by Women
- Galleries
- Community Connections & How-To Videos
- COVID-19 Data Stories Gallery
- Themes Gallery
- Data Stories Gallery
- R Script Showcase
- Webinars and Video Gallery
- Quick Measures Gallery
- 2021 MSBizAppsSummit Gallery
- 2020 MSBizAppsSummit Gallery
- 2019 MSBizAppsSummit Gallery
- Events
- Ideas
- Custom Visuals Ideas
- Issues
- Issues
- Events
- Upcoming Events
- Community Blog
- Power BI Community Blog
- Custom Visuals Community Blog
- Community Support
- Community Accounts & Registration
- Using the Community
- Community Feedback
Register now to learn Fabric in free live sessions led by the best Microsoft experts. From Apr 16 to May 9, in English and Spanish.
- Power BI forums
- Forums
- Get Help with Power BI
- Desktop
- Measure with multiple formats
- Subscribe to RSS Feed
- Mark Topic as New
- Mark Topic as Read
- Float this Topic for Current User
- Bookmark
- Subscribe
- Printer Friendly Page
- Mark as New
- Bookmark
- Subscribe
- Mute
- Subscribe to RSS Feed
- Permalink
- Report Inappropriate Content
Measure with multiple formats
So, this problem has been slowly killing me for the past week and I was hoping some of you could help me.
I need a matrix where the user selects the columns to display and I have made a working version. However, there is one problem, it relies on one measure and it cannot be multiple formats (percent, number etc.) while being filtered by a different table. Let me show you!
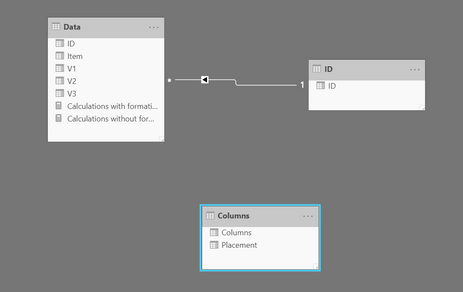
Here is the model (please note; the ID table filters multiple tables in the real version, so using this for filtering is more user-friendly).
Here is the measure with formatting (the other measure is identical except for the format())
Calculations with formatting =
Var Columnsvalue = selectedvalue('Columns'[Columns])
Var V1 = Format(sum(Data[V1]);"percent")
Var V2 = Sum(Data[V2])
Var V3 = sum(Data[V3])

return
Switch(
    Columnsvalue;
    "V1";V1;
    "V2";V2;
    "V3";V3
)
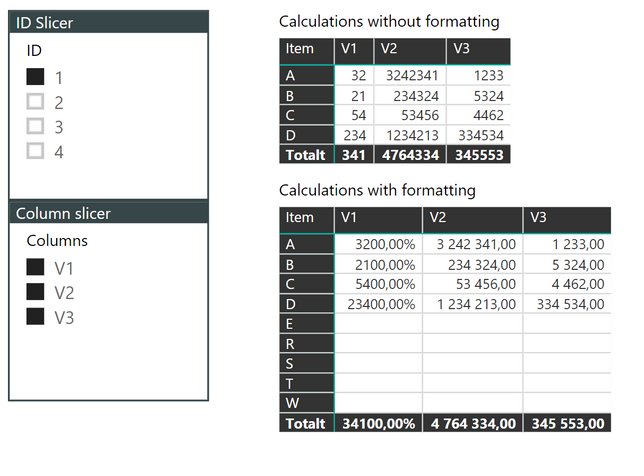
As you can see, it works fine without the formatting (the below matrix is only for illustration and obviously doesn't need to be a percent).
Basically, when formatted it shows all items regardless of ID. This becomes an issue when the list of items grows.
The above ID comes from the ID table, but the strangest part is that it works fine when filtered from the same table.
Can anyone explain this behavior to me?
Solved! Go to Solution.
- Mark as New
- Bookmark
- Subscribe
- Mute
- Subscribe to RSS Feed
- Permalink
- Report Inappropriate Content
Perfect! thanks for sharing the data @Anonymous. Had to do a little work around, but this worked. Let me know if that works in your production environment.
Calculations with formatting =
Var Columnsvalue = selectedvalue('Columns'[Columns])
Var V1 = IF(ISBLANK(SUM(Data[V1])),BLANK(),Format(sum(Data[V1]),"percent"))
Var V2 = Sum(Data[V2])
Var V3 = sum(Data[V3])

return
Switch(
    Columnsvalue,
    "V1",V1,
    "V2",V2,
    "V3",V3
)
You can also use the following to fix the 3200% issue and change the formatting to 1 decimal rather than two. I trust you can edit it if you want no decimals, just giving you the options.
Var V1 = IF(ISBLANK(SUM(Data[V1])),BLANK(),Format(sum(Data[V1])/100,"#.0%"))
- Mark as New
- Bookmark
- Subscribe
- Mute
- Subscribe to RSS Feed
- Permalink
- Report Inappropriate Content
If I understand correctly, you have two formulas 1.) with formatting, and 2.) without formatting.
You posted your version with formatting in your post. Could you share the one without formatting as well?
As far as the percent showing up as 3200% instead of 32%, the easiest way to fix this is simply to divide by 100 (see below).
Var V1 = Format(sum(Data[V1])/100;"percent")
- Mark as New
- Bookmark
- Subscribe
- Mute
- Subscribe to RSS Feed
- Permalink
- Report Inappropriate Content
Here is the measure without formatting;
Calculations without formatting =
Var Columnsvalue = selectedvalue('Columns'[Columns])
Var V1 = sum(Data[V1])
Var V2 = Sum(Data[V2])
Var V3 = sum(Data[V3])

return
Switch(
    Columnsvalue;
    "V1";V1;
    "V2";V2;
    "V3";V3
)
The problem is not that is shows as 3200%, but that it shows the blank rows when filtered.
These numbers come from smashing my keyboard, so just pretend it says 32% 🙂
- Mark as New
- Bookmark
- Subscribe
- Mute
- Subscribe to RSS Feed
- Permalink
- Report Inappropriate Content
@Anonymous Sorry I miscommunicated. I thought you were asking for help on both issues.
To address the extra rows, (I could be wrong on this) I believe what is happening is when you put the formatting in the calculation, it hardcodes and applies to all rows such that it no longer sees it as a blank row, but rather a row with a % sign in it.
To avoid this behavior.... Not 100% sure.
This might be a dumb question, but have you tried to use the formatting in the modelling tab?
- Mark as New
- Bookmark
- Subscribe
- Mute
- Subscribe to RSS Feed
- Permalink
- Report Inappropriate Content
I should have described the problem better for you. English is not my first language if that is a valid excuse 🙂
I've been thinking something similar, but then I realized that it works when I use ID from the Data table.
Unfortunately, this is not an elegant solution when ID filters multiple tables.
Formatting through the modeling tab only works when the measure has a shared format (as far as I know).
- Mark as New
- Bookmark
- Subscribe
- Mute
- Subscribe to RSS Feed
- Permalink
- Report Inappropriate Content
Sorry, I think I don't understand your data structure. Can you share a sample PBIX or Sample data?
- Mark as New
- Bookmark
- Subscribe
- Mute
- Subscribe to RSS Feed
- Permalink
- Report Inappropriate Content
@jtownsend21
It's sample data so here is the OneDrive link.
https://1drv.ms/u/s!Au4_sEke_Sk1gtFhN_balmBLTO0rAg
The real version has multiple tables like Data that are all connected through a shared ID.
It is also many more items and columns 🙂
- Mark as New
- Bookmark
- Subscribe
- Mute
- Subscribe to RSS Feed
- Permalink
- Report Inappropriate Content
Perfect! thanks for sharing the data @Anonymous. Had to do a little work around, but this worked. Let me know if that works in your production environment.
Calculations with formatting =
Var Columnsvalue = selectedvalue('Columns'[Columns])
Var V1 = IF(ISBLANK(SUM(Data[V1])),BLANK(),Format(sum(Data[V1]),"percent"))
Var V2 = Sum(Data[V2])
Var V3 = sum(Data[V3])

return
Switch(
    Columnsvalue,
    "V1",V1,
    "V2",V2,
    "V3",V3
)
You can also use the following to fix the 3200% issue and change the formatting to 1 decimal rather than two. I trust you can edit it if you want no decimals, just giving you the options.
Var V1 = IF(ISBLANK(SUM(Data[V1])),BLANK(),Format(sum(Data[V1])/100,"#.0%"))
- Mark as New
- Bookmark
- Subscribe
- Mute
- Subscribe to RSS Feed
- Permalink
- Report Inappropriate Content
This is great!
I ran some quick tests and it seems to be working in my production environment.
thank you!
- Mark as New
- Bookmark
- Subscribe
- Mute
- Subscribe to RSS Feed
- Permalink
- Report Inappropriate Content
Great! glad to hear it!
Helpful resources

Microsoft Fabric Learn Together
Covering the world! 9:00-10:30 AM Sydney, 4:00-5:30 PM CET (Paris/Berlin), 7:00-8:30 PM Mexico City

Power BI Monthly Update - April 2024
Check out the April 2024 Power BI update to learn about new features.

| User | Count |
|---|---|
| 114 | |
| 100 | |
| 81 | |
| 70 | |
| 62 |
| User | Count |
|---|---|
| 148 | |
| 116 | |
| 104 | |
| 90 | |
| 65 |


