- Power BI forums
- Updates
- News & Announcements
- Get Help with Power BI
- Desktop
- Service
- Report Server
- Power Query
- Mobile Apps
- Developer
- DAX Commands and Tips
- Custom Visuals Development Discussion
- Health and Life Sciences
- Power BI Spanish forums
- Translated Spanish Desktop
- Power Platform Integration - Better Together!
- Power Platform Integrations (Read-only)
- Power Platform and Dynamics 365 Integrations (Read-only)
- Training and Consulting
- Instructor Led Training
- Dashboard in a Day for Women, by Women
- Galleries
- Community Connections & How-To Videos
- COVID-19 Data Stories Gallery
- Themes Gallery
- Data Stories Gallery
- R Script Showcase
- Webinars and Video Gallery
- Quick Measures Gallery
- 2021 MSBizAppsSummit Gallery
- 2020 MSBizAppsSummit Gallery
- 2019 MSBizAppsSummit Gallery
- Events
- Ideas
- Custom Visuals Ideas
- Issues
- Issues
- Events
- Upcoming Events
- Community Blog
- Power BI Community Blog
- Custom Visuals Community Blog
- Community Support
- Community Accounts & Registration
- Using the Community
- Community Feedback
Register now to learn Fabric in free live sessions led by the best Microsoft experts. From Apr 16 to May 9, in English and Spanish.
- Power BI forums
- Forums
- Get Help with Power BI
- Desktop
- Matrix table that is to output the date from the d...
- Subscribe to RSS Feed
- Mark Topic as New
- Mark Topic as Read
- Float this Topic for Current User
- Bookmark
- Subscribe
- Printer Friendly Page
- Mark as New
- Bookmark
- Subscribe
- Mute
- Subscribe to RSS Feed
- Permalink
- Report Inappropriate Content
Matrix table that is to output the date from the date table even though there are no appointments
Hi there,
I have the following situation and I also hope for help.
My report consists of two tables. A date table that outputs the date from today's date 5 days in the past and 3 days in the future -> Date = CALENDAR (TODAY () -5, TODAY () +3) and then a appointment table. This includes values such as the appointment date, the employee name and much more. Now I have created a matrix table that shows me all appointments grouped by day. So far no problem, everything works fine up to this point.
However, I would like that the period (-5 days and +3 days from today's date) is always given in the matrix, regardless of whether there is an appointment in my appointment table or not.
As an an example:
Date table:
01/01/2022
01/02/2022
....
01/09/2022
appointment table:
01/01/2022 Employee A
01/01/2022 Employee B
01/03/2022 Employee B
01/08/2022 Employee A
Result:
| 01/01/2022 | Employee A |
| Employee B | |
| 01/02/2022 | |
| 01/03/2022 | Employee B |
| 01/04/2022 | |
| 01/05/2022 | |
| 01/06/2022 | |
| 01/07/2022 | |
| 01/08/2022 | Employee A |
| 01/09/2022 |
I'm looking forward to your ideas on how I can solve this 🙂
Kind regards
Solved! Go to Solution.
- Mark as New
- Bookmark
- Subscribe
- Mute
- Subscribe to RSS Feed
- Permalink
- Report Inappropriate Content
Hi @Meeresblume
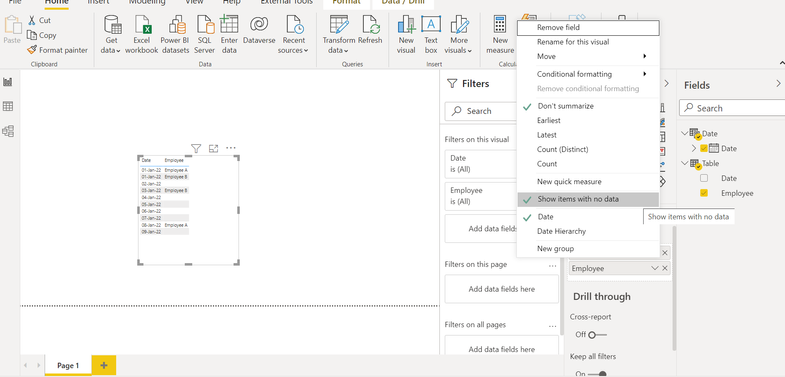
In the Visualizations pane, for the Date column from the Date table, change the option to show items with now value:
If this post helps, please consider accepting it as the solution to help the other members find it more quickly.
Appreciate your Kudos!!
LinkedIn: www.linkedin.com/in/vahid-dm/
- Mark as New
- Bookmark
- Subscribe
- Mute
- Subscribe to RSS Feed
- Permalink
- Report Inappropriate Content
Thanks for your answer.
I added the option once, but unfortunately the other dates still don't appear to me.
- Mark as New
- Bookmark
- Subscribe
- Mute
- Subscribe to RSS Feed
- Permalink
- Report Inappropriate Content
Solution found.
After selecting the option, I had to click on the following symbols:
Helpful resources

Microsoft Fabric Learn Together
Covering the world! 9:00-10:30 AM Sydney, 4:00-5:30 PM CET (Paris/Berlin), 7:00-8:30 PM Mexico City

Power BI Monthly Update - April 2024
Check out the April 2024 Power BI update to learn about new features.

| User | Count |
|---|---|
| 107 | |
| 100 | |
| 80 | |
| 63 | |
| 58 |
| User | Count |
|---|---|
| 148 | |
| 111 | |
| 94 | |
| 84 | |
| 67 |


