- Power BI forums
- Updates
- News & Announcements
- Get Help with Power BI
- Desktop
- Service
- Report Server
- Power Query
- Mobile Apps
- Developer
- DAX Commands and Tips
- Custom Visuals Development Discussion
- Health and Life Sciences
- Power BI Spanish forums
- Translated Spanish Desktop
- Power Platform Integration - Better Together!
- Power Platform Integrations (Read-only)
- Power Platform and Dynamics 365 Integrations (Read-only)
- Training and Consulting
- Instructor Led Training
- Dashboard in a Day for Women, by Women
- Galleries
- Community Connections & How-To Videos
- COVID-19 Data Stories Gallery
- Themes Gallery
- Data Stories Gallery
- R Script Showcase
- Webinars and Video Gallery
- Quick Measures Gallery
- 2021 MSBizAppsSummit Gallery
- 2020 MSBizAppsSummit Gallery
- 2019 MSBizAppsSummit Gallery
- Events
- Ideas
- Custom Visuals Ideas
- Issues
- Issues
- Events
- Upcoming Events
- Community Blog
- Power BI Community Blog
- Custom Visuals Community Blog
- Community Support
- Community Accounts & Registration
- Using the Community
- Community Feedback
Register now to learn Fabric in free live sessions led by the best Microsoft experts. From Apr 16 to May 9, in English and Spanish.
- Power BI forums
- Forums
- Get Help with Power BI
- Desktop
- Market Basket Analysis - finding the revenue from ...
- Subscribe to RSS Feed
- Mark Topic as New
- Mark Topic as Read
- Float this Topic for Current User
- Bookmark
- Subscribe
- Printer Friendly Page
- Mark as New
- Bookmark
- Subscribe
- Mute
- Subscribe to RSS Feed
- Permalink
- Report Inappropriate Content
Market Basket Analysis - finding the revenue from clients who bought the product combo
Hi everyone,
Appreciate if anyone could help me on this.
I'm currently doing a project on market basket analysis (also called product association analysis).
The purpose is to find combinations of products that clients buy and that we can potentially cross-sell to future customers. For example, from our data, we may have seen that there were a number of clients buying milk (product A) and cookies (product B) from us. This would mean that we can cross-sell cookies to clients who buy only milk from us in the future.
In usual cases, this analysis would be done by finding the NUMBER of clients who buy both products (reference: here).
E.g. 20 clients have bought milk, 13 clients have bought cookies, intersecting them = 7 clients bought both products, etc.
However, in my case, I want to find the revenue received from the clients who have bought both products.
E.g. 20 clients have spent $20 buying milk, 13 clients have spent $13 buying cookies, intersecting them = 7 clients have spent $14 buying both products.
My dataset is structured such that it's by client & transactions and only 1 product per transaction.
Please see below for the simplified sample. (Of course there are more than 2 products in my data source.)
| Client | TransactionNo | Product | Revenue |
| AAA | 1 | Milk | 20 |
| BBB | 2 | Cookies | 10 |
| BBB | 3 | Milk | 16 |
| CCC | 4 | Cookies | 8 |
| DDD | 5 | Cookies | 6 |
| DDD | 6 | Milk | 24 |
I have tried to adapt the formulas and analysis guide from here and here.
I extracted the product column from the data table into 2 queries, 'product dim row' for the matrix row and 'product dim col' for the matrix column.
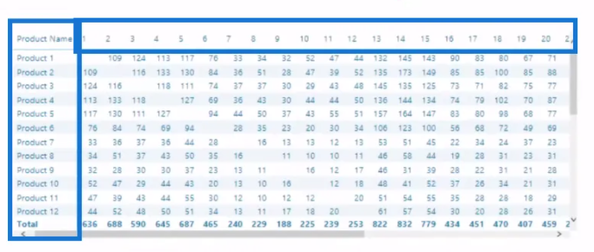
With the measure below, I could replicate this table above:
PurchasedBoth =
VAR productrow = VALUES(data[Client])
VAR productcol = CALCULATETABLE(VALUES(data[Client]),ALL(data), TREATAS(VALUES('Product dim column'[Product]),data[Product]))
RETURN
COUNTROWS(INTERSECT(productrow, productcol)))
However, I am so far unable to get the revenue received. The measure I have used is below (a bunch of gibberish text because I kept edting and testing):
RevPurchasedBoth =
VAR productrow = SUMX(SUMMARIZE(data, data[Client], data[Product]),CALCULATE(SUM(data[Revenue])))
VAR productcol = SUMX(SUMMARIZE(data, data[Client], data[Product]),CALCULATE(SUM(data[Revenue])))
// TREATAS(VALUES('Product dim col'[Product]),data[Product]))
VAR tow1 = VALUES('Product dim row'[Product])
VAR tow2 = VALUES('Product dim col'[Product])
RETURN CALCULATE(productrow+productcol, INTERSECT(tow1,tow2))
//CALCULATE(SUM(data[Revenue]),FILTER(ALL(data), CONTAINS(VALUES('Product dim row'[Product]), 'Product dim row'[Product], data[Product])), FILTER(ALL(data), CONTAINS(VALUES('Product dim col'[Product]), 'Product dim col'[Product]], data[Product])))))
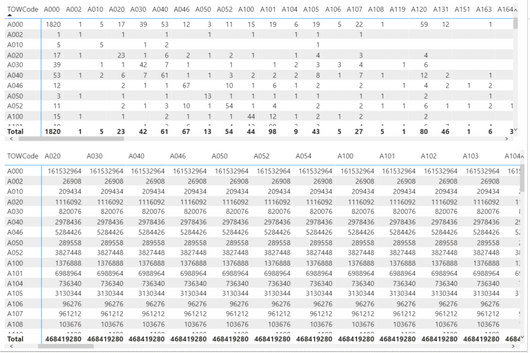
This is what I have gotten:
Appreciate any PBI guru's input on where I've gone wrong or pointing me to the right resource/direction!! Thank you very much.
Solved! Go to Solution.
- Mark as New
- Bookmark
- Subscribe
- Mute
- Subscribe to RSS Feed
- Permalink
- Report Inappropriate Content
Update2:
I got the values I needed!
revrow = SUM(data[Revenue])
revcol = CALCULATE(data[revrow],ALL('Product dim row'), TREATAS(VALUES('Product dim col'[Product]),data[Product]))
Honestly, I don't know why it works now when I created 2 separate measures (revrow and revcol). It didn't work when I put them as VARs in RevPurchasedBoth measure. Appreciate it if anyone could explain!
- Mark as New
- Bookmark
- Subscribe
- Mute
- Subscribe to RSS Feed
- Permalink
- Report Inappropriate Content
Update:
I'm so close to getting the correct values!!
I have edited my measure to this:
- Mark as New
- Bookmark
- Subscribe
- Mute
- Subscribe to RSS Feed
- Permalink
- Report Inappropriate Content
Update2:
I got the values I needed!
revrow = SUM(data[Revenue])
revcol = CALCULATE(data[revrow],ALL('Product dim row'), TREATAS(VALUES('Product dim col'[Product]),data[Product]))
Honestly, I don't know why it works now when I created 2 separate measures (revrow and revcol). It didn't work when I put them as VARs in RevPurchasedBoth measure. Appreciate it if anyone could explain!
Helpful resources

Microsoft Fabric Learn Together
Covering the world! 9:00-10:30 AM Sydney, 4:00-5:30 PM CET (Paris/Berlin), 7:00-8:30 PM Mexico City

Power BI Monthly Update - April 2024
Check out the April 2024 Power BI update to learn about new features.

| User | Count |
|---|---|
| 114 | |
| 100 | |
| 75 | |
| 73 | |
| 49 |
| User | Count |
|---|---|
| 145 | |
| 109 | |
| 109 | |
| 90 | |
| 64 |


