- Power BI forums
- Updates
- News & Announcements
- Get Help with Power BI
- Desktop
- Service
- Report Server
- Power Query
- Mobile Apps
- Developer
- DAX Commands and Tips
- Custom Visuals Development Discussion
- Health and Life Sciences
- Power BI Spanish forums
- Translated Spanish Desktop
- Power Platform Integration - Better Together!
- Power Platform Integrations (Read-only)
- Power Platform and Dynamics 365 Integrations (Read-only)
- Training and Consulting
- Instructor Led Training
- Dashboard in a Day for Women, by Women
- Galleries
- Community Connections & How-To Videos
- COVID-19 Data Stories Gallery
- Themes Gallery
- Data Stories Gallery
- R Script Showcase
- Webinars and Video Gallery
- Quick Measures Gallery
- 2021 MSBizAppsSummit Gallery
- 2020 MSBizAppsSummit Gallery
- 2019 MSBizAppsSummit Gallery
- Events
- Ideas
- Custom Visuals Ideas
- Issues
- Issues
- Events
- Upcoming Events
- Community Blog
- Power BI Community Blog
- Custom Visuals Community Blog
- Community Support
- Community Accounts & Registration
- Using the Community
- Community Feedback
Register now to learn Fabric in free live sessions led by the best Microsoft experts. From Apr 16 to May 9, in English and Spanish.
- Power BI forums
- Forums
- Get Help with Power BI
- Desktop
- Managing Roles Using Measures, Is it Possible?
- Subscribe to RSS Feed
- Mark Topic as New
- Mark Topic as Read
- Float this Topic for Current User
- Bookmark
- Subscribe
- Printer Friendly Page
- Mark as New
- Bookmark
- Subscribe
- Mute
- Subscribe to RSS Feed
- Permalink
- Report Inappropriate Content
Managing Roles Using Measures, Is it Possible?
Hello,
I've got a redacted pbix version of my problem if any of you want to take a shot at it.
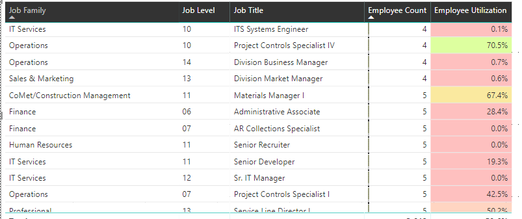
I'm creating a table that counts employee's based off of their level, Job Title and Family.
It's counting employee's based off a measure. Employee Count = DISTINCTCOUNT('Employee Detail'[Employee])
I want to assign a role that filters out any rows in the table that have an employee count of 2 or less.
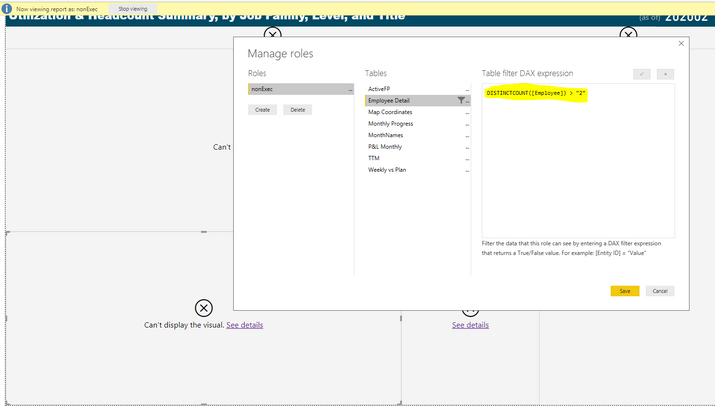
I'm using Row-Level Security to do this. (Manage Role Function)
When I go to Manage Roles and I use the employee count measure in the DAX formula, I do not get an error, but my visuals go blank.
This alternate DAX formula does not work as well. I do not get an error, but my visuals go blank.
DISTINCTCOUNT([Employee]) > "2"
Does anyone have a solution to my problem? Or is what i'm trying to do even possible?
any advice is appreciated!
Thanks,
Tom
Solved! Go to Solution.
- Mark as New
- Bookmark
- Subscribe
- Mute
- Subscribe to RSS Feed
- Permalink
- Report Inappropriate Content
So there are 2 big problems here. The first one is that you are comparing a numeric value to a string of "2" so this always returns false. But even if you fix this and change the expression to the following:
DISTINCTCOUNT([Employee]) > 2
The second problem is that security filters are applied as a table filter so the DISTINCTCOUNT() is returning the total number of distinct [employee] values in the table.
I think to do what you want you will need to create a calculated column in your employee detail table which calculates your distinct count and then your role will simply have [My New Column] > 2
- Mark as New
- Bookmark
- Subscribe
- Mute
- Subscribe to RSS Feed
- Permalink
- Report Inappropriate Content
For anyone else who reads this thread later with a similar issue, the solution was to come up with a calculated column which counted the number of employees with the same JobFamily, JobLevel and JobTitle. Then we created a normal row level security roles to only show where this count was greater than 2.
Below is the code for the calculated column
EmployeesPerFamily-Job-Title =
VAR _currentJobFamily = Sheet1[Job Family]
VAR _currentJobLevel = Sheet1[Job Level]
VAR _currentJobTitle = Sheet1[Job Title]
return
    COUNTROWS(
        SUMMARIZE(
            FILTER(ALL(Sheet1[Job Family], Sheet1[Job Level], Sheet1[Job Title], Sheet1[Employee]),
                Sheet1[Job Family] = _currentJobFamily
                && Sheet1[Job Level] = _currentJobLevel
                && Sheet1[Job Title] = _currentJobTitle
            ),
            [Employee]
        )
    )
- Mark as New
- Bookmark
- Subscribe
- Mute
- Subscribe to RSS Feed
- Permalink
- Report Inappropriate Content
So there are 2 big problems here. The first one is that you are comparing a numeric value to a string of "2" so this always returns false. But even if you fix this and change the expression to the following:
DISTINCTCOUNT([Employee]) > 2
The second problem is that security filters are applied as a table filter so the DISTINCTCOUNT() is returning the total number of distinct [employee] values in the table.
I think to do what you want you will need to create a calculated column in your employee detail table which calculates your distinct count and then your role will simply have [My New Column] > 2
- Mark as New
- Bookmark
- Subscribe
- Mute
- Subscribe to RSS Feed
- Permalink
- Report Inappropriate Content
The file you sent me was perfect.
DAX was the answer.
- Mark as New
- Bookmark
- Subscribe
- Mute
- Subscribe to RSS Feed
- Permalink
- Report Inappropriate Content
For anyone else who reads this thread later with a similar issue, the solution was to come up with a calculated column which counted the number of employees with the same JobFamily, JobLevel and JobTitle. Then we created a normal row level security roles to only show where this count was greater than 2.
Below is the code for the calculated column
EmployeesPerFamily-Job-Title =
VAR _currentJobFamily = Sheet1[Job Family]
VAR _currentJobLevel = Sheet1[Job Level]
VAR _currentJobTitle = Sheet1[Job Title]
return
    COUNTROWS(
        SUMMARIZE(
            FILTER(ALL(Sheet1[Job Family], Sheet1[Job Level], Sheet1[Job Title], Sheet1[Employee]),
                Sheet1[Job Family] = _currentJobFamily
                && Sheet1[Job Level] = _currentJobLevel
                && Sheet1[Job Title] = _currentJobTitle
            ),
            [Employee]
        )
    )
- Mark as New
- Bookmark
- Subscribe
- Mute
- Subscribe to RSS Feed
- Permalink
- Report Inappropriate Content
Thanks for the response!
Much appreciated with the observations there.
I went ahead and created a calculated column to count up the distinct employee Job Families, Levels, and Title combinations (DISTINCTCOUNT function). But the column just retruned the the same value for each row, which is the total of all distinct combinations.
- Mark as New
- Bookmark
- Subscribe
- Mute
- Subscribe to RSS Feed
- Permalink
- Report Inappropriate Content
@tmendoza it will work and I used it many times, must be something else going on. If you can share pbix file wiht sample data (remove sensitive information) and I can take a look.
Subscribe to the @PowerBIHowTo YT channel for an upcoming video on List and Record functions in Power Query!!
Learn Power BI and Fabric - subscribe to our YT channel - Click here: @PowerBIHowTo
If my solution proved useful, I'd be delighted to receive Kudos. When you put effort into asking a question, it's equally thoughtful to acknowledge and give Kudos to the individual who helped you solve the problem. It's a small gesture that shows appreciation and encouragement! ❤
Did I answer your question? Mark my post as a solution. Proud to be a Super User! Appreciate your Kudos 🙂
Feel free to email me with any of your BI needs.
- Mark as New
- Bookmark
- Subscribe
- Mute
- Subscribe to RSS Feed
- Permalink
- Report Inappropriate Content
Great news,
I ran it past my boss and he approved my redacted version of the pbix file i've been working on for your guy's eyes.
It's been stripped of pretty much everything except for the table I've been trying to solve.
Is there away to stop people from seeing rows that have an employee count of less than 2?
- Mark as New
- Bookmark
- Subscribe
- Mute
- Subscribe to RSS Feed
- Permalink
- Report Inappropriate Content
Hey there,
Thanks for responding, anything helps. It's good to know that there is a possible solution for this.
Not quite sure that I can send the file out. You see, the measure is directly corrilated to an employee column in the data set.
If I were to remove this sensitive data it would destroy the measure and the count in the visual.
Thus, I need the sensetive data in there in order for the visual to work.
What formula do you usually use to make this work for you?
Helpful resources

Microsoft Fabric Learn Together
Covering the world! 9:00-10:30 AM Sydney, 4:00-5:30 PM CET (Paris/Berlin), 7:00-8:30 PM Mexico City

Power BI Monthly Update - April 2024
Check out the April 2024 Power BI update to learn about new features.

| User | Count |
|---|---|
| 112 | |
| 100 | |
| 80 | |
| 64 | |
| 57 |
| User | Count |
|---|---|
| 146 | |
| 110 | |
| 93 | |
| 84 | |
| 67 |


