- Power BI forums
- Updates
- News & Announcements
- Get Help with Power BI
- Desktop
- Service
- Report Server
- Power Query
- Mobile Apps
- Developer
- DAX Commands and Tips
- Custom Visuals Development Discussion
- Health and Life Sciences
- Power BI Spanish forums
- Translated Spanish Desktop
- Power Platform Integration - Better Together!
- Power Platform Integrations (Read-only)
- Power Platform and Dynamics 365 Integrations (Read-only)
- Training and Consulting
- Instructor Led Training
- Dashboard in a Day for Women, by Women
- Galleries
- Community Connections & How-To Videos
- COVID-19 Data Stories Gallery
- Themes Gallery
- Data Stories Gallery
- R Script Showcase
- Webinars and Video Gallery
- Quick Measures Gallery
- 2021 MSBizAppsSummit Gallery
- 2020 MSBizAppsSummit Gallery
- 2019 MSBizAppsSummit Gallery
- Events
- Ideas
- Custom Visuals Ideas
- Issues
- Issues
- Events
- Upcoming Events
- Community Blog
- Power BI Community Blog
- Custom Visuals Community Blog
- Community Support
- Community Accounts & Registration
- Using the Community
- Community Feedback
Register now to learn Fabric in free live sessions led by the best Microsoft experts. From Apr 16 to May 9, in English and Spanish.
- Power BI forums
- Forums
- Get Help with Power BI
- Desktop
- Looking for a Better Way of Showing Contracts Acti...
- Subscribe to RSS Feed
- Mark Topic as New
- Mark Topic as Read
- Float this Topic for Current User
- Bookmark
- Subscribe
- Printer Friendly Page
- Mark as New
- Bookmark
- Subscribe
- Mute
- Subscribe to RSS Feed
- Permalink
- Report Inappropriate Content
Looking for a Better Way of Showing Contracts Active by Date
Hi All, I have a situation where my report and visual are doing exactly what I want them to do, but I am trying to find another way that will be less of a burden on my data model and be faster for the user(s) of my report.
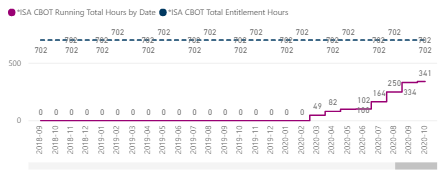
I want to look at services used over the life of a contract, and show the data as such. That is, a customer may pass the start date of their contract, but three months may go by before they consume any of their entitlement, so the graph should show zero for those months and those months only. For example, here is a contract that begins in December 2019. I do NOT want this where it shows all dates because the contract didn't begin until Dec 2019:
I only want where it shows the date the contract began as below.
The blue dotted line is what they are entitled to, while the purple line is their usage.
To accomplish this, and since I have contract start date and contract end date, I created a table called Contract Active Dates in Power BI with DAX. This creates a table that has a date and contract number for every single date a contract number is active:
- Mark as New
- Bookmark
- Subscribe
- Mute
- Subscribe to RSS Feed
- Permalink
- Report Inappropriate Content
@Shelley , refer to my blog around a similar topic if that can help
or video :https://youtu.be/e6Y-l_JtCq4
Microsoft Power BI Learning Resources, 2023 !!
Learn Power BI - Full Course with Dec-2022, with Window, Index, Offset, 100+ Topics !!
Did I answer your question? Mark my post as a solution! Appreciate your Kudos !! Proud to be a Super User! !!
Helpful resources

Microsoft Fabric Learn Together
Covering the world! 9:00-10:30 AM Sydney, 4:00-5:30 PM CET (Paris/Berlin), 7:00-8:30 PM Mexico City

Power BI Monthly Update - April 2024
Check out the April 2024 Power BI update to learn about new features.

| User | Count |
|---|---|
| 113 | |
| 99 | |
| 82 | |
| 70 | |
| 60 |
| User | Count |
|---|---|
| 149 | |
| 114 | |
| 107 | |
| 89 | |
| 67 |


