- Power BI forums
- Updates
- News & Announcements
- Get Help with Power BI
- Desktop
- Service
- Report Server
- Power Query
- Mobile Apps
- Developer
- DAX Commands and Tips
- Custom Visuals Development Discussion
- Health and Life Sciences
- Power BI Spanish forums
- Translated Spanish Desktop
- Power Platform Integration - Better Together!
- Power Platform Integrations (Read-only)
- Power Platform and Dynamics 365 Integrations (Read-only)
- Training and Consulting
- Instructor Led Training
- Dashboard in a Day for Women, by Women
- Galleries
- Community Connections & How-To Videos
- COVID-19 Data Stories Gallery
- Themes Gallery
- Data Stories Gallery
- R Script Showcase
- Webinars and Video Gallery
- Quick Measures Gallery
- 2021 MSBizAppsSummit Gallery
- 2020 MSBizAppsSummit Gallery
- 2019 MSBizAppsSummit Gallery
- Events
- Ideas
- Custom Visuals Ideas
- Issues
- Issues
- Events
- Upcoming Events
- Community Blog
- Power BI Community Blog
- Custom Visuals Community Blog
- Community Support
- Community Accounts & Registration
- Using the Community
- Community Feedback
Register now to learn Fabric in free live sessions led by the best Microsoft experts. From Apr 16 to May 9, in English and Spanish.
- Power BI forums
- Forums
- Get Help with Power BI
- Desktop
- Line chart with two sets of date values? Currently...
- Subscribe to RSS Feed
- Mark Topic as New
- Mark Topic as Read
- Float this Topic for Current User
- Bookmark
- Subscribe
- Printer Friendly Page
- Mark as New
- Bookmark
- Subscribe
- Mute
- Subscribe to RSS Feed
- Permalink
- Report Inappropriate Content
Line chart with two sets of date values? Currently only one appearing
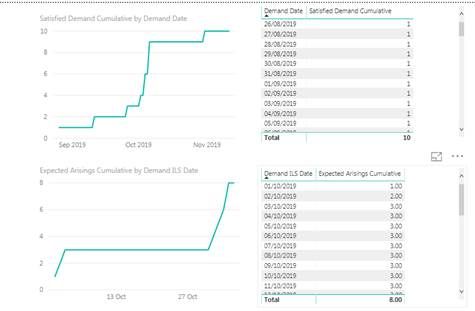
I'm trying to achieve the following. Two cumulative measures on the same graph.
I can get each graph displaying individually as per the below.
However when attempting to build based on the same graph, I get the following. It only plots one set of values on the visual. I’ve observed that the line drawn depends on which date is placed which on the ‘Shared Axis’. If I place Demand Date above Demand ILS Date then it will plot the respective Demand ILS Date values.
Anyone have any ideas of where I'm going wrong.
Other notes:
Each date has it's own separate date dimension
- Mark as New
- Bookmark
- Subscribe
- Mute
- Subscribe to RSS Feed
- Permalink
- Report Inappropriate Content
Probably instantly fixed by creating a date table and relating your two date fields to it
- Mark as New
- Bookmark
- Subscribe
- Mute
- Subscribe to RSS Feed
- Permalink
- Report Inappropriate Content
I already have multiple date dimensions so each of Demand Date and ILS Date have their own date table. But that then makes plotting both on the same graph an issue unless someone can correct me
- Mark as New
- Bookmark
- Subscribe
- Mute
- Subscribe to RSS Feed
- Permalink
- Report Inappropriate Content
I would look at using the same date table and using USERELATIONSHIP() in the measure where you want to use the inactive relationship.
Here is a blog post covering the topic: https://carldesouza.com/power-bi-dax-userelationship-multiple-dates/
- Mark as New
- Bookmark
- Subscribe
- Mute
- Subscribe to RSS Feed
- Permalink
- Report Inappropriate Content
Hi Adam,
I just wanted to clarify as I am confused by this.
As per
https://docs.microsoft.com/en-us/power-bi/guidance/star-schema#role-playing-dimensions
I created multiple date dimensions so I have a date dimension for 'Demand Date' and 'ILS Date' but I can't plot them on the same graph.
- Mark as New
- Bookmark
- Subscribe
- Mute
- Subscribe to RSS Feed
- Permalink
- Report Inappropriate Content
The link you reference includes both solutions and the benefit they mention for having separate tables is that you don't need to use the USERELATIONSHIP() functionality to build the various measures so it simplifies the development experience.
One of the drawbacks of the multiple tables solution is that you can't plot measures that are based on different dates using the same date axis, if you want to do this you need to have a single common date table and activate the correct relationship depending on the measure using USERELATIONSHIP().
- Mark as New
- Bookmark
- Subscribe
- Mute
- Subscribe to RSS Feed
- Permalink
- Report Inappropriate Content
Thank you very much,.
Looks like I may need to rebuild my data model to use a single date table. Seems like the limitations about not being able to have two axis on the date is too serious for our requirements
Helpful resources

Microsoft Fabric Learn Together
Covering the world! 9:00-10:30 AM Sydney, 4:00-5:30 PM CET (Paris/Berlin), 7:00-8:30 PM Mexico City

Power BI Monthly Update - April 2024
Check out the April 2024 Power BI update to learn about new features.

| User | Count |
|---|---|
| 109 | |
| 95 | |
| 77 | |
| 65 | |
| 53 |
| User | Count |
|---|---|
| 144 | |
| 105 | |
| 102 | |
| 89 | |
| 63 |


