- Power BI forums
- Updates
- News & Announcements
- Get Help with Power BI
- Desktop
- Service
- Report Server
- Power Query
- Mobile Apps
- Developer
- DAX Commands and Tips
- Custom Visuals Development Discussion
- Health and Life Sciences
- Power BI Spanish forums
- Translated Spanish Desktop
- Power Platform Integration - Better Together!
- Power Platform Integrations (Read-only)
- Power Platform and Dynamics 365 Integrations (Read-only)
- Training and Consulting
- Instructor Led Training
- Dashboard in a Day for Women, by Women
- Galleries
- Community Connections & How-To Videos
- COVID-19 Data Stories Gallery
- Themes Gallery
- Data Stories Gallery
- R Script Showcase
- Webinars and Video Gallery
- Quick Measures Gallery
- 2021 MSBizAppsSummit Gallery
- 2020 MSBizAppsSummit Gallery
- 2019 MSBizAppsSummit Gallery
- Events
- Ideas
- Custom Visuals Ideas
- Issues
- Issues
- Events
- Upcoming Events
- Community Blog
- Power BI Community Blog
- Custom Visuals Community Blog
- Community Support
- Community Accounts & Registration
- Using the Community
- Community Feedback
Register now to learn Fabric in free live sessions led by the best Microsoft experts. From Apr 16 to May 9, in English and Spanish.
- Power BI forums
- Forums
- Get Help with Power BI
- Desktop
- Re: Line & Stacked Column Chart, with more than 1 ...
- Subscribe to RSS Feed
- Mark Topic as New
- Mark Topic as Read
- Float this Topic for Current User
- Bookmark
- Subscribe
- Printer Friendly Page
- Mark as New
- Bookmark
- Subscribe
- Mute
- Subscribe to RSS Feed
- Permalink
- Report Inappropriate Content
Line & Stacked Column Chart, with more than 1 line shown
Hello,
I'm trying to create a report that compares monthly production plan for a yearly basis, with total sales forecast and total inventory stock balance for every month. The total sales forecast and total balance is plotted in the line, and the column is the production plan for every part code.
Below is the current chart plotted using Excel for more information which need to achieve :

Based on the above source data, the chart is plotted as following:-

Using PowerBI Desktop, import raw data from excel and after some massage, able to prepare source table as following:-

Due to the raw data do not have period indicated, hence prepare another set of data to indicate mth01 is Jan2018. This is to ensure everytime i can just maintain the correct period in the excel and information can be refreshed easily.

My current chart @ Power BI, not really reflecting what i need. I am not sure is it because the source data preparation issue or it is not possible to replace my current chart using power BI.

Problem of Chart in Power BI
1. How to change those different partcode under one column, from column mth01 to column mth12?
2. How the total sales and total balance should be presented in table, so that i will only get 2 lines? ( currently, if choose all the period, all the 12 lines will be shown)
3. How to change mth01 to Jan'18 based on the period file i maintain?
I have upload my pbix here, for you to get better understanding on how those data structure looks like.
Any help or advice is very much appreciate here!
Thank you in advance.
Andrea Ko
Solved! Go to Solution.
- Mark as New
- Bookmark
- Subscribe
- Mute
- Subscribe to RSS Feed
- Permalink
- Report Inappropriate Content
Hi andreako,
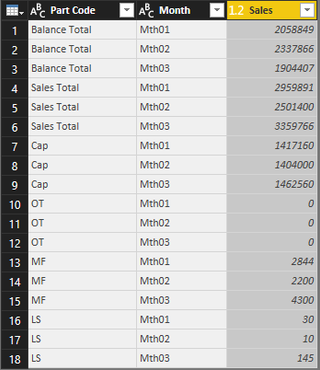
Can't achieve your raw data so i input a simpler sample table like below.

To achieve your requirement, you can click Query Editors->Transform->Click on Mth01~Mth02->Unpivot Columns, the result will be like below:

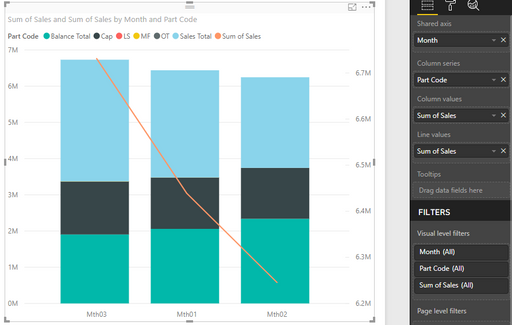
After applied&close, you can create a stack&line chart, drag [Month] column to Shared axis field, [Part Code] column to column series field, [Values] column to column values and line values field with sum aggregation.

Please check if it can meet your requirement.
Regards,
Jimmy Tao
- Mark as New
- Bookmark
- Subscribe
- Mute
- Subscribe to RSS Feed
- Permalink
- Report Inappropriate Content
Hi andreako,
Can't achieve your raw data so i input a simpler sample table like below.

To achieve your requirement, you can click Query Editors->Transform->Click on Mth01~Mth02->Unpivot Columns, the result will be like below:

After applied&close, you can create a stack&line chart, drag [Month] column to Shared axis field, [Part Code] column to column series field, [Values] column to column values and line values field with sum aggregation.

Please check if it can meet your requirement.
Regards,
Jimmy Tao
- Mark as New
- Bookmark
- Subscribe
- Mute
- Subscribe to RSS Feed
- Permalink
- Report Inappropriate Content
Hi Jimmy,
Really appreciate of your advice, it's works great!
Sorry abt the original source file, attached again :
I have further question, if you can help me with it.
How to change the "Period" according from Jan to Dec?

- Mark as New
- Bookmark
- Subscribe
- Mute
- Subscribe to RSS Feed
- Permalink
- Report Inappropriate Content
Hi andreako,
"How to change the "Period" according from Jan to Dec?"
<--- Could you give more details about your requirement?
Regards,
Jimmy Tao
- Mark as New
- Bookmark
- Subscribe
- Mute
- Subscribe to RSS Feed
- Permalink
- Report Inappropriate Content
Dear Jimmy,
Deeply appreciate on the help that given to me.
All my previous problem being solved.
With the new problem, I have further upload my latest report (Report PBIX) with the source file
I wish to Sort the column by Jan 2018 until Dec 2018, so if now i sort the Period, it will follow alphabetical order.
Eg,

In the Period.xls i have tried a few maintenance, current upload pbix is based on Format A.
Target to show in the chart is MMM-YY format.
I ever tried the FormatB, the sorting is correct from Jan ~ Dec, but how i change to wording like Jan 2018?
As for Format C, it becomes a date format, but i would to have only MMM-YY without the day,
| Key | Period (FormatA) | YYYYMM (FormatB) | MMM-YY(FormatC) |
| Mth01 | Jan'18 | 201801 | Jan-18 |
| Mth02 | Feb'18 | 201802 | Feb-18 |
| Mth03 | Mar'18 | 201803 | Mar-18 |
| Mth04 | Apr'18 | 201804 | Apr-18 |
| Mth05 | May'18 | 201805 | May-18 |
| Mth06 | Jun'18 | 201806 | Jun-18 |
| Mth07 | Jul'18 | 201807 | Jul-18 |
| Mth08 | Aug'18 | 201808 | Aug-18 |
| Mth09 | Sep'18 | 201809 | Sep-18 |
| Mth10 | Oct'18 | 201810 | Oct-18 |
| Mth11 | Nov'18 | 201811 | Nov-18 |
| Mth12 | Dec'18 | 201812 | Dec-18 |
Sorry for the long winded explanation, just to share what other options which being tried but still cannot get the ultimate aim.
Thank you in advance.
Andrea Ko
Helpful resources

Microsoft Fabric Learn Together
Covering the world! 9:00-10:30 AM Sydney, 4:00-5:30 PM CET (Paris/Berlin), 7:00-8:30 PM Mexico City

Power BI Monthly Update - April 2024
Check out the April 2024 Power BI update to learn about new features.

| User | Count |
|---|---|
| 111 | |
| 97 | |
| 80 | |
| 69 | |
| 59 |
| User | Count |
|---|---|
| 150 | |
| 119 | |
| 104 | |
| 87 | |
| 67 |
