Beginner in PBI here. I want to visualise historical trends across few departments.
What I have (data):
| Department | Q1'17 | Q2'17 | Q3'17 | Q4'17 | Q1'18 | Q2'18 | Q3'18 | Q4'18 | Q1'19 |
| Dep1 | 0.0% | 2.7% | 0.7% | 0.0% | 0.0% | 0.0% | 0.0% | 0.0% | 0.0% |
| Dep2 | 1.7% | 2.5% | 0.7% | 1.5% | 1.5% | 1.0% | 0.0% | 0.0% | 0.0% |
| Dep3 | 0.0% | 0.0% | 0.0% | 0.0% | 0.0% | 0.0% | 0.0% | 0.0% | 0.0% |
| Dep4 | 0.0% | 0.0% | 0.0% | 4.0% | 0.0% | 0.0% | 0.3% | 0.0% | 0.0% |
| Dep5 | 0.0% | 0.0% | 0.0% | 0.9% | 0.0% | 3.0% | 0.3% | 0.0% | 0.0% |
| Dep6 | 2.9% | 3.0% | 0.0% | 0.0% | 0.0% | 3.0% | 1.5% | 2.0% | 1.6% |
| Dep7 | 0.0% | 0.0% | 0.0% | 3.6% | 3.6% | 0.0% | 0.0% | 0.0% | 0.0% |
| Dep8 | 0.0% | 0.0% | 0.0% | 0.0% | 0.0% | 0.0% | 0.0% | 0.0% | 0.0% |
| Dep9 | 0.0% | 0.0% | 0.0% | 1.3% | 1.8% | 3.0% | 0.0% | 0.0% | 0.0% |
| Dep10 | 0.0% | 0.0% | 0.0% | 5.8% | 3.1% | 4.0% | 1.3% | 1.0% | 0.7% |
| Dep11 | 0.0% | 0.0% | 0.0% | 3.9% | 0.3% | 2.0% | 0.9% | 0.0% | 0.0% |
| Dep12 | 0.0% | 0.0% | 0.0% | 0.0% | 0.0% | 0.0% | 0.0% | 0.0% | 0.0% |
What I want to create (excel example):
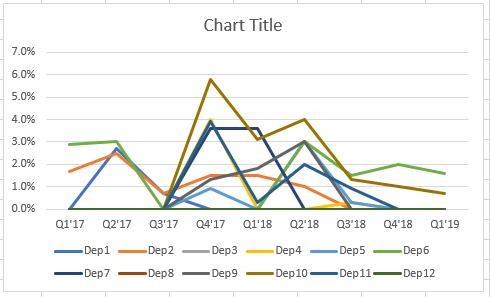
No matter how hard I try in PBI I cannot recreate this scenario that takes me 3s to create in excel. PBI does sort the data by score (percentage value) and Quarters are all overthe place. No matter what I do I cannot force it to sort by quarter and then go from Q1'2017 until Q1'2019.
If I replace quarters with actual dates it works ok, but the "31.03.2017" or March 2017 datapoints looks countrintuitive and make the data harder to digest than simple quarters. Is there something I'm missing here?


